
Every Linux system generates logs. From boot events and kernel messages to application errors and service crashes, logs are the single most important diagnostic tool available to a system administrator. Before systemd became the dominant init system, logs were scattered across multiple files in /var/log/, managed by syslog daemons like rsyslog or syslog-ng. While those tools still exist, systemd introduced its own logging system called the journal, managed by a component called systemd-journald. In this guide, you will learn how to use journalctl to view, filter, search, and manipulate systemd logs on a Linux server.
Prerequisites
- A Linux system running systemd (Ubuntu 16.04+, CentOS 7+, Debian 8+, Fedora, Arch, etc.)
- A user account with sudo privileges or root access
Understanding the systemd Journal
Before diving into commands, it helps to understand what the journal actually is.
systemd-journald is a system service that collects log messages from:
- The Linux kernel (via /dev/kmsg)
- Early boot messages
- Standard output and standard error of system services
- Syslog messages (from applications using the syslog API)
- Audit records (from the kernel audit subsystem)
- Structured log messages from applications using the systemd journal API
Unlike traditional text-based log files, journal data is stored in a binary format in /var/log/journal/ (for persistent storage) or /run/log/journal/ (for volatile, memory-only storage that does not survive reboots).
Basic Usage: Viewing All Logs
The simplest way to use journalctl is to run it with no arguments:
journalctl
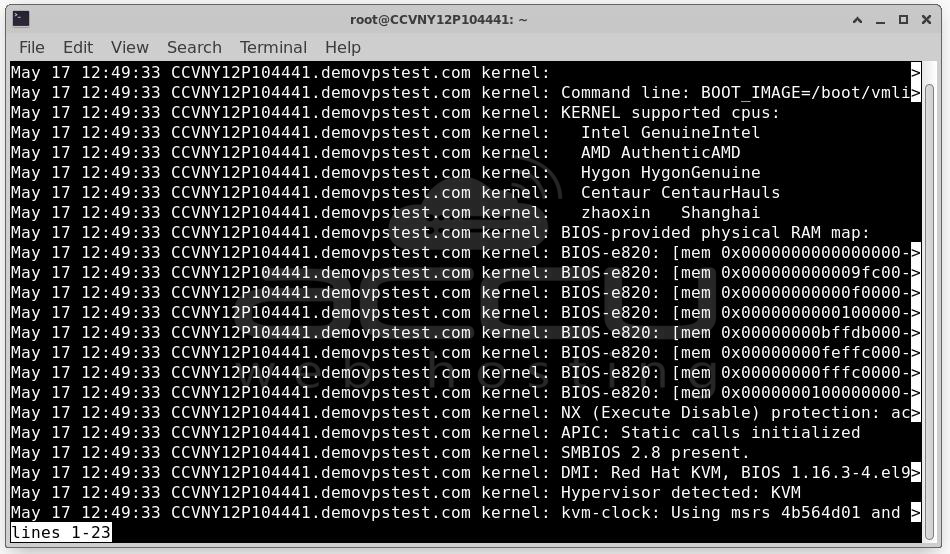
This displays all journal entries from oldest to newest, piped through a pager (usually less) so you can scroll through them. The output looks similar to traditional syslog output:
May 18 10:23:01 myserver systemd[1]: Started Daily apt download activities.
May 18 10:23:01 myserver systemd[1]: anacron.service: Succeeded.
May 18 10:25:12 myserver sshd[3421]: Accepted publickey for admin from 192.168.1.10
May 18 10:25:13 myserver sudo[3445]: admin : TTY=pts/0 ; PWD=/home/admin ; USER=root
Each line contains: timestamp, hostname, process name and PID, and the log message.
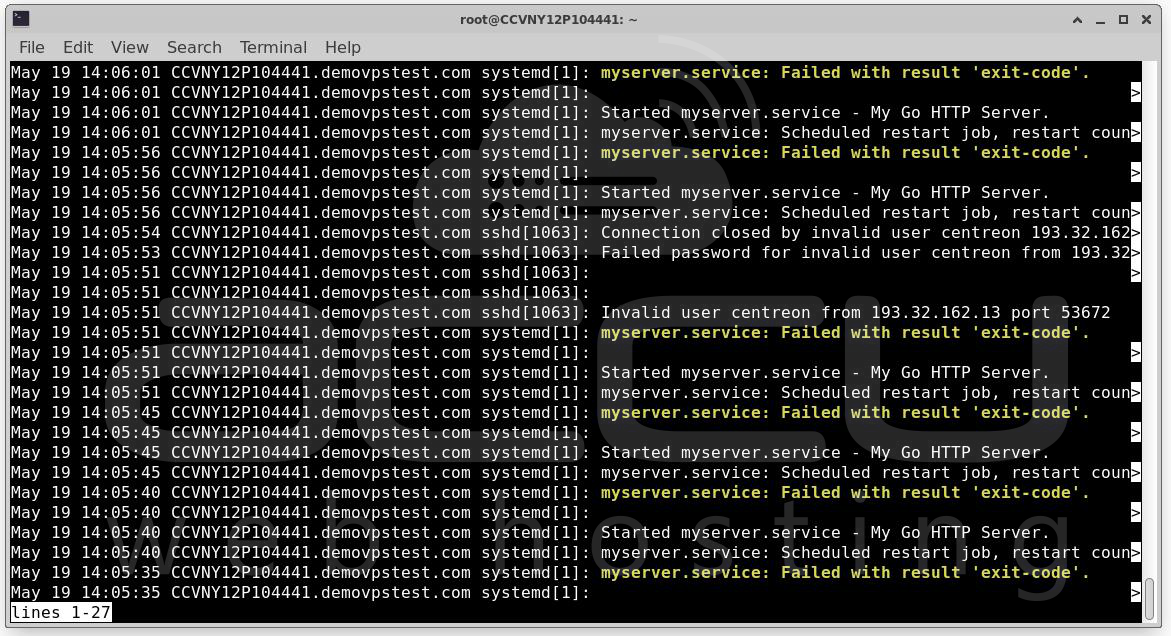
To view the most recent entries first (reverse chronological order):
journalctl -r
Operation 1: Viewing Logs Without a Pager
By default, journalctl pipes output through less. If you want to print all output directly to the terminal (useful for scripting or piping to other tools), use:
journalctl --no-pager
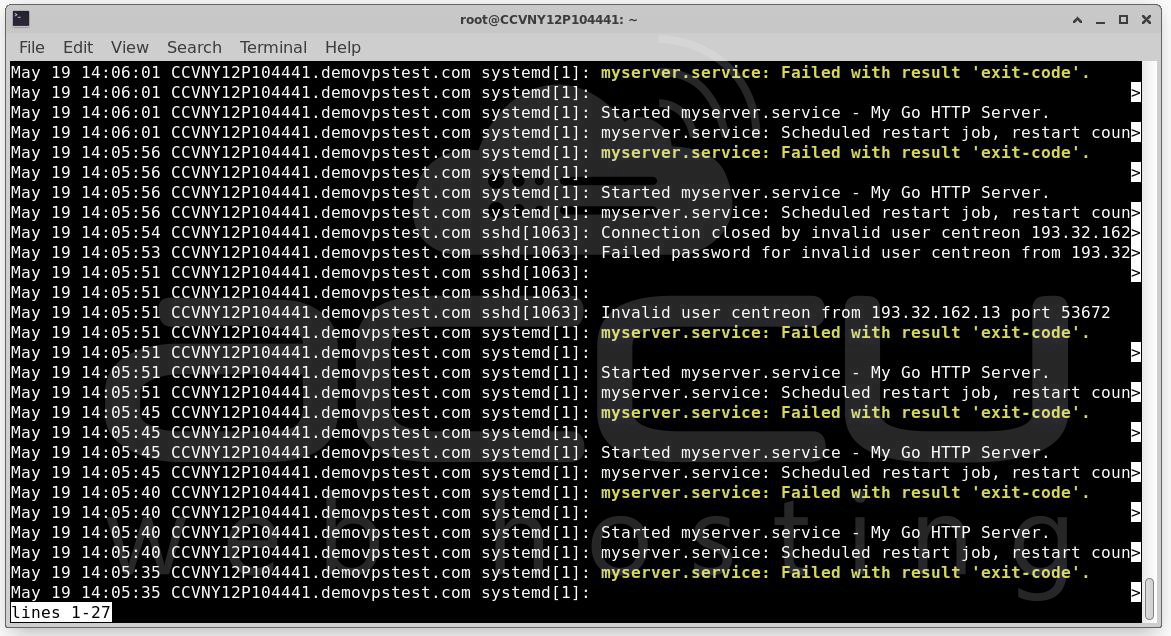
You can then pipe the output to other tools:
journalctl --no-pager | grep "error"
journalctl --no-pager | wc -l
journalctl --no-pager > all-logs.txt
Operation 2: Following Logs in Real Time
One of the most common tasks is watching logs as they arrive — similar to tail -f on a log file:
journalctl -f
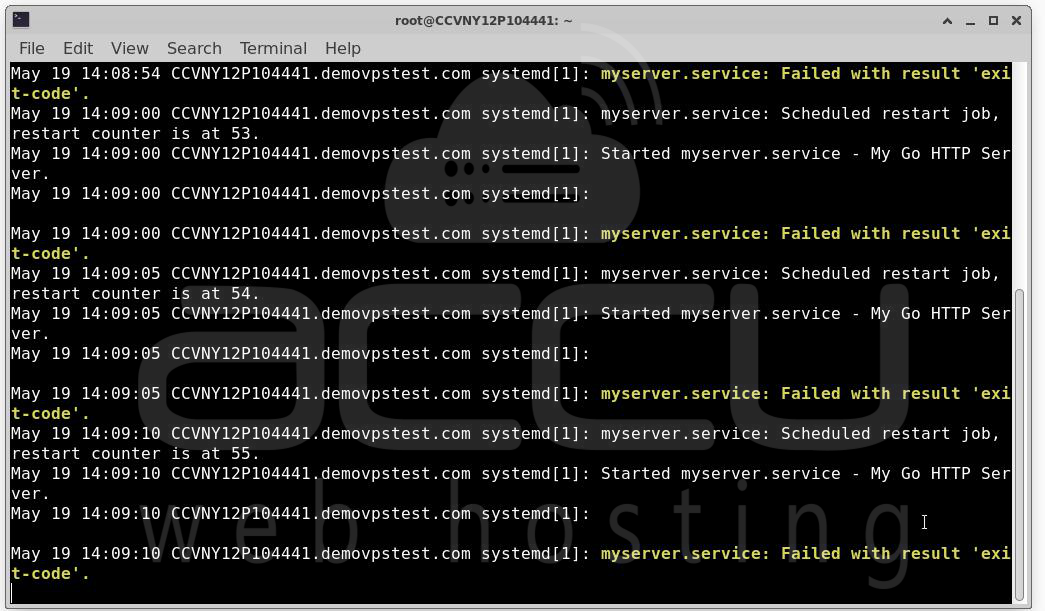
This streams new journal entries as they appear. It is invaluable when you are:
- Restarting a service and watching for errors
- Testing an application and monitoring its output
- Debugging a script that writes to the journal
Press Ctrl+C to stop the stream.
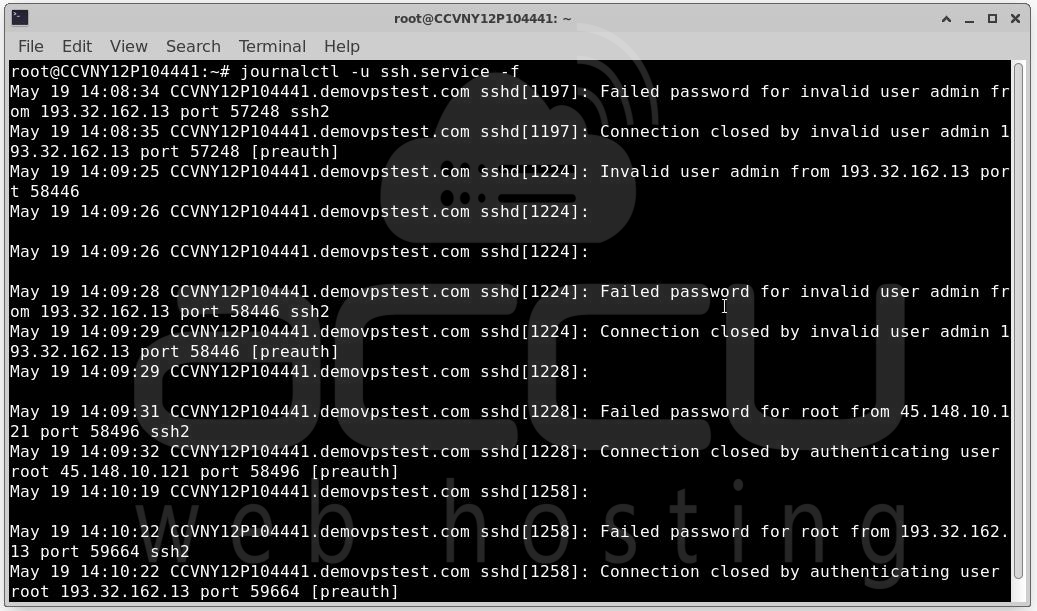
You can combine -f with filters. For example, to follow logs for a specific service in real time:
journalctl -u ssh.service -f
Operation 3: Filtering by Systemd Unit (Service)
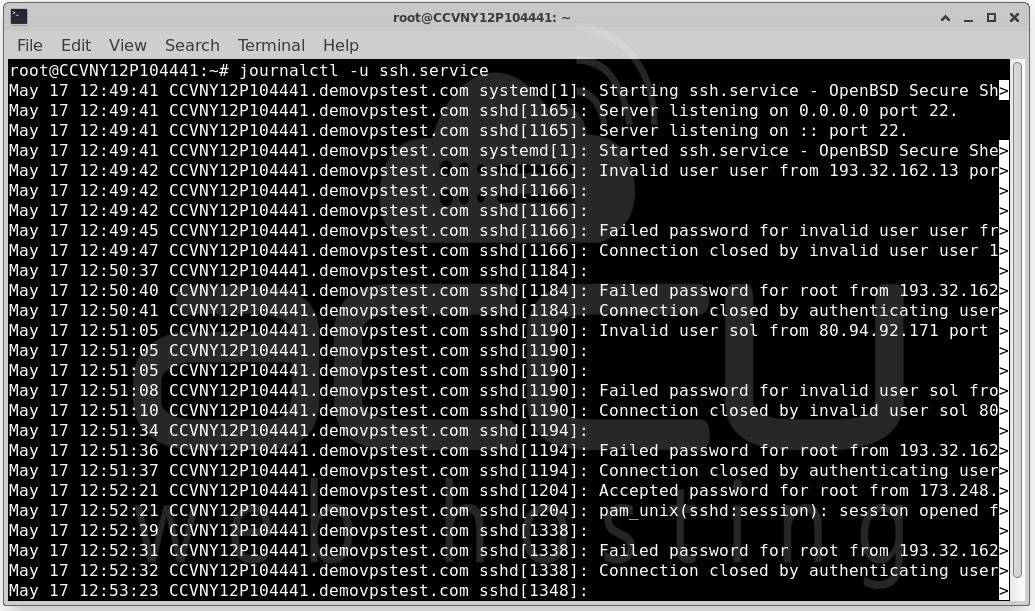
Filtering by service unit is one of the most frequently used journalctl features. Use the -u flag followed by the service name:
journalctl -u ssh.service
You can query multiple units at once:
journalctl -u docker.service -u cron.service
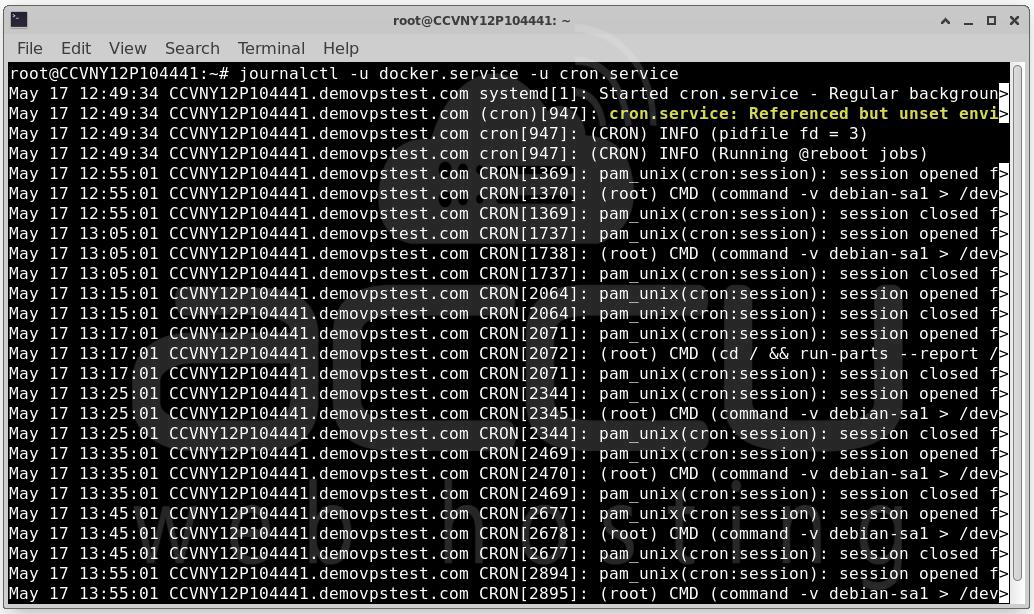
This is far more convenient than grepping through /var/log/syslog for a specific process name, especially when a service uses multiple processes or spawns child processes under different names.
To see only the most recent entries for a service:
journalctl -u cron.service -n 50
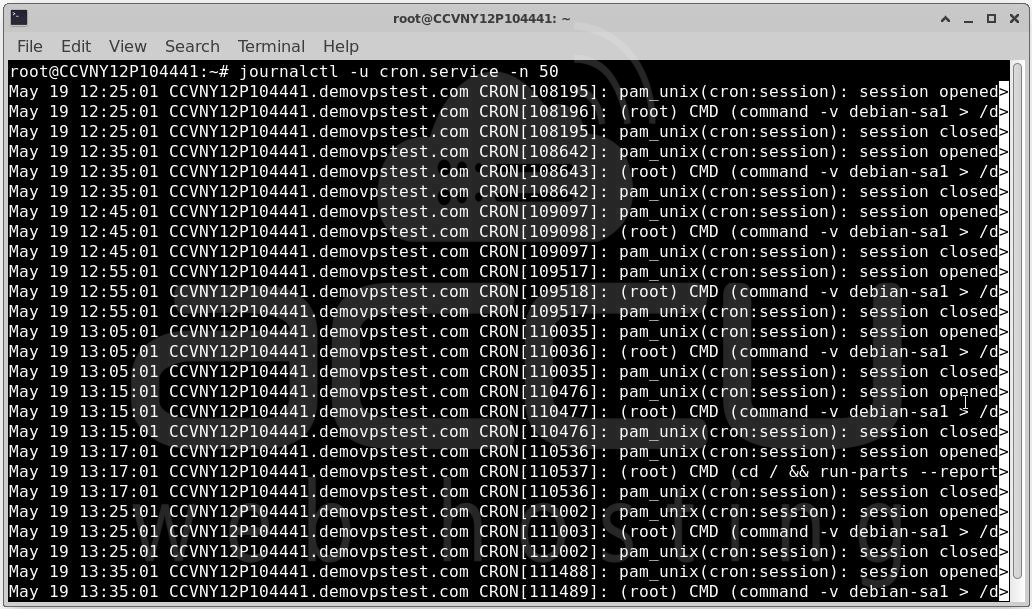
This shows the last 50 lines for the nginx service.
Operation 4: Viewing a Specific Number of Lines
The -n flag limits output to the last N lines, similar to tail -n:
journalctl -n 100
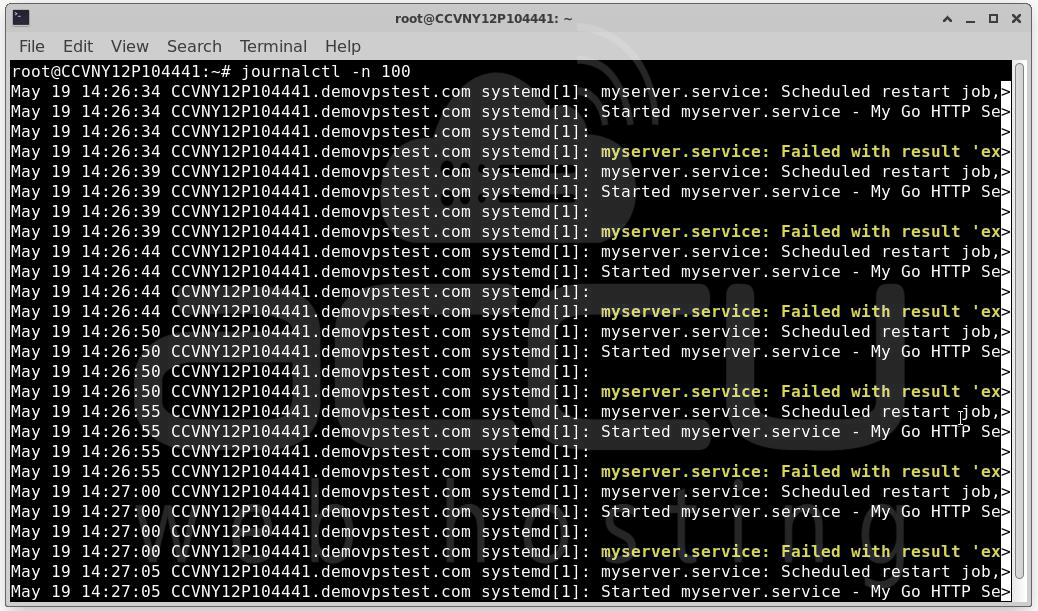
Shows the last 100 journal entries across all services.
journalctl -n 20 -u ssh.service
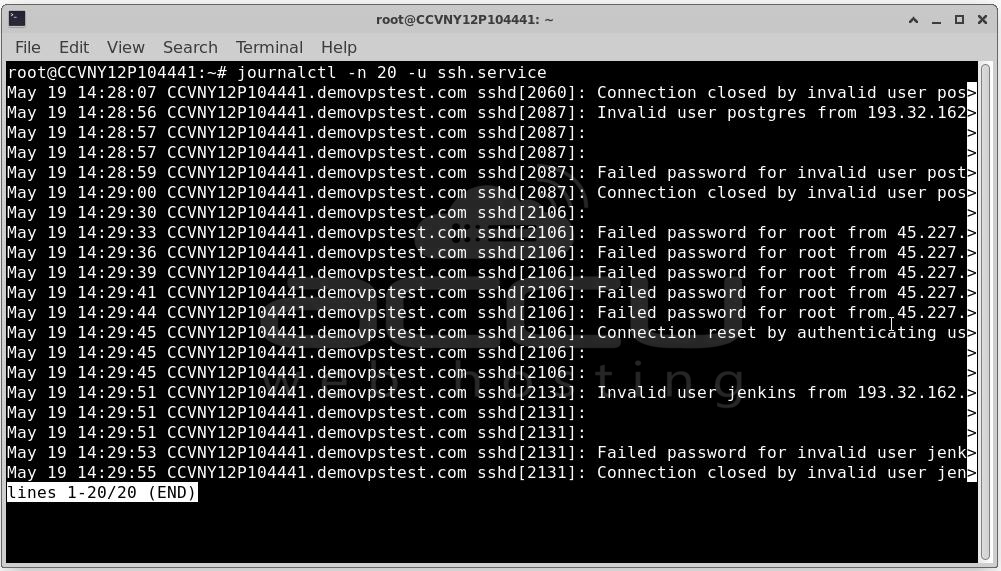
Shows the last 20 lines for the SSH daemon.
If you omit the number after -n, it defaults to 10 lines:
journalctl -n
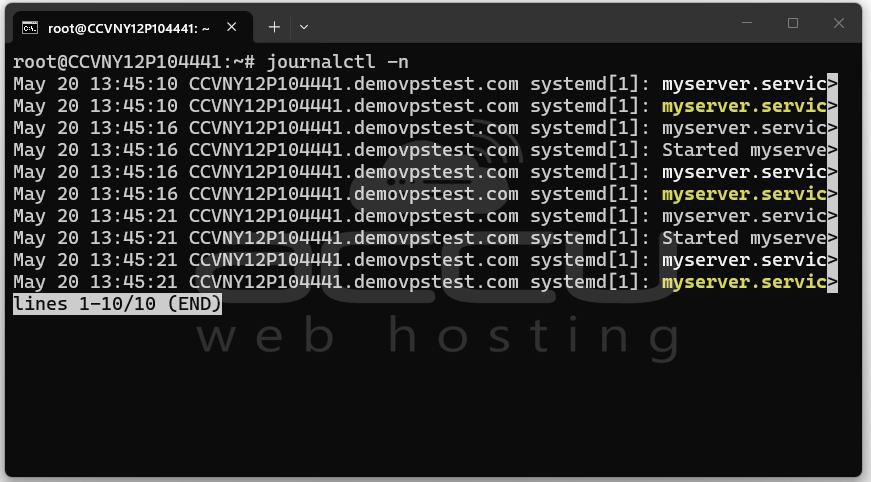
Operation 5: Filtering by Boot Session
The journal tracks which boot session each log entry came from. This is extremely useful for diagnosing issues that happened in a previous boot — a feature that traditional log files do not support natively.
List all available boot sessions:
journalctl --list-boots
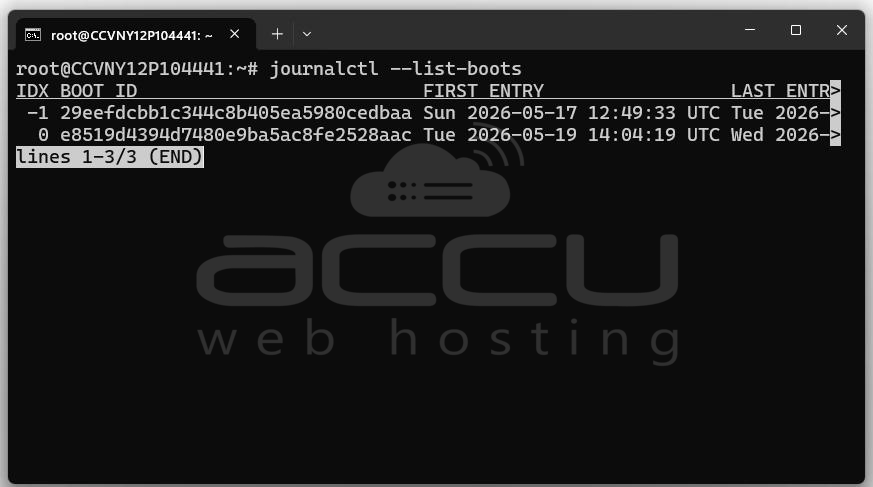
Output example:
-3 abc123def456 Thu 2026-05-16 08:10:02 UTC—Thu 2026-05-16 22:45:11 UTC
-2 def789ghi012 Fri 2026-05-17 07:30:15 UTC—Fri 2026-05-17 23:59:58 UTC
-1 jkl345mno678 Sat 2026-05-18 09:00:05 UTC—Sat 2026-05-18 18:30:00 UTC
0 pqr901stu234 Sun 2026-05-19 07:45:00 UTC—present
The leftmost column is the boot offset: 0 is the current boot, -1 is the previous boot, -2 is two boots ago, and so on.
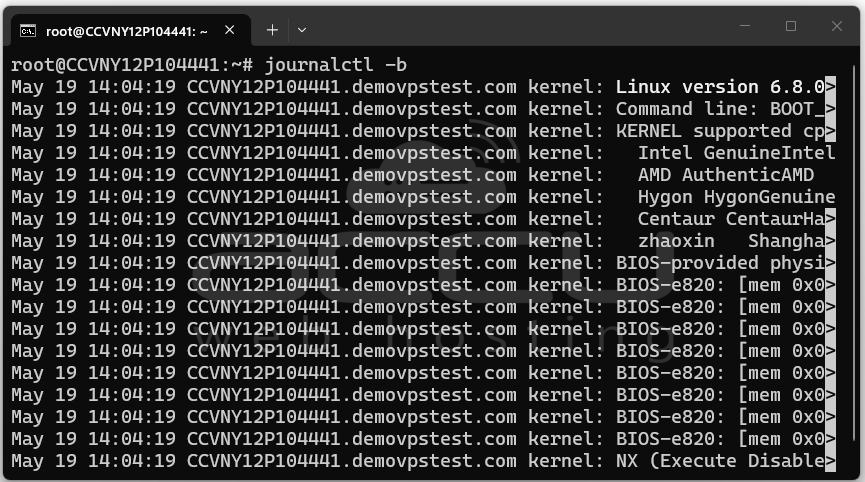
View logs from the current boot:
journalctl -b
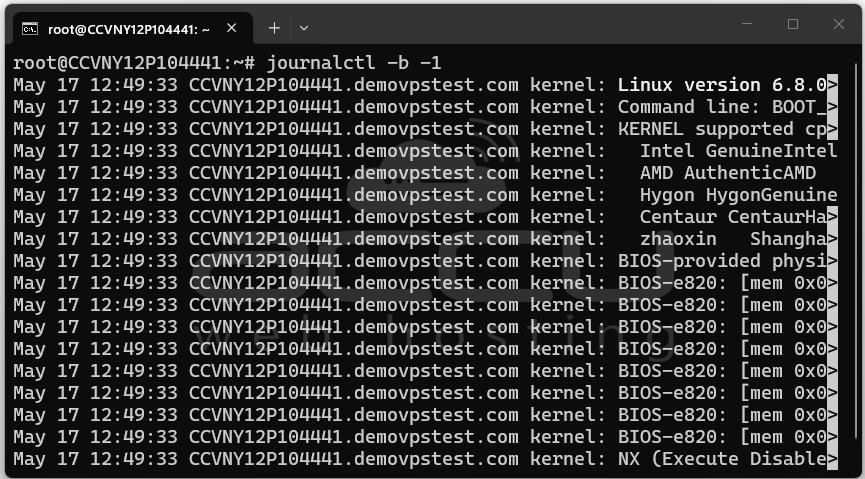
View logs from the previous boot:
journalctl -b -1
View logs from two boots ago:
journalctl -b -2
View logs from a specific boot by ID:
journalctl -b 29eefdcbb1c344c8b405ea5980cedbaa
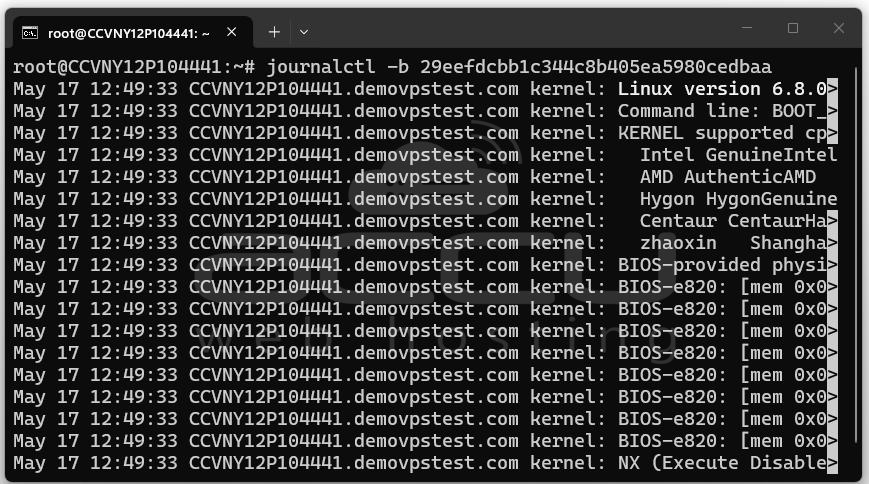
This is particularly powerful when a server crashed or rebooted unexpectedly — you can pull up the logs from the last boot session and see exactly what happened before the crash.
Operation 6: Filtering by Time and Date
You can filter journal entries by time ranges using --since and --until. These accept flexible date/time formats:
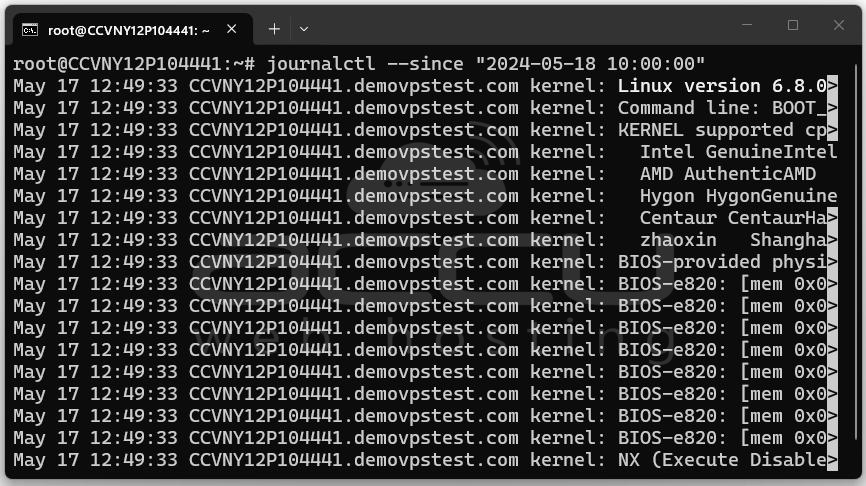
View logs since a specific date and time:
journalctl --since "2026-05-18 10:00:00"
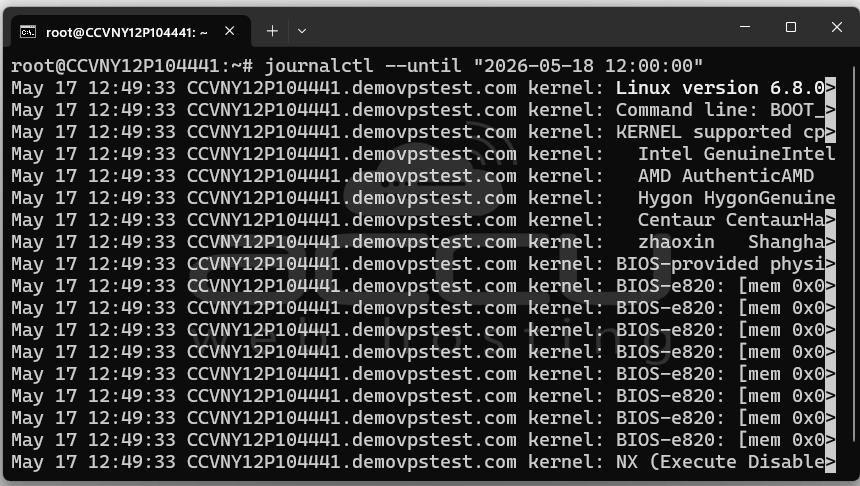
View logs until a specific time:
journalctl --until "2026-05-18 12:00:00"
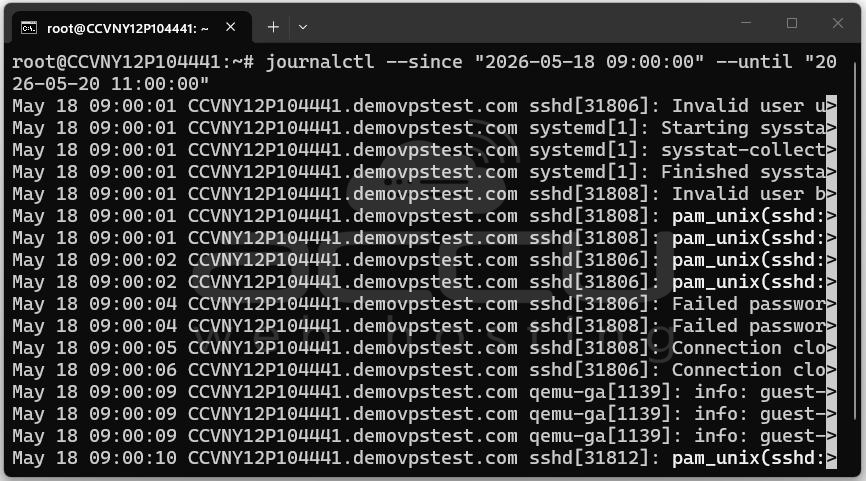
View logs in a specific time window:
journalctl --since "2026-05-18 09:00:00" --until "2026-05-20 11:00:00"
Using relative time expressions:
journalctl --since "1 hour ago"
journalctl --since "2 days ago"
journalctl --since yesterday
journalctl --since today
journalctl --since "1 hour ago" --until "30 minutes ago"
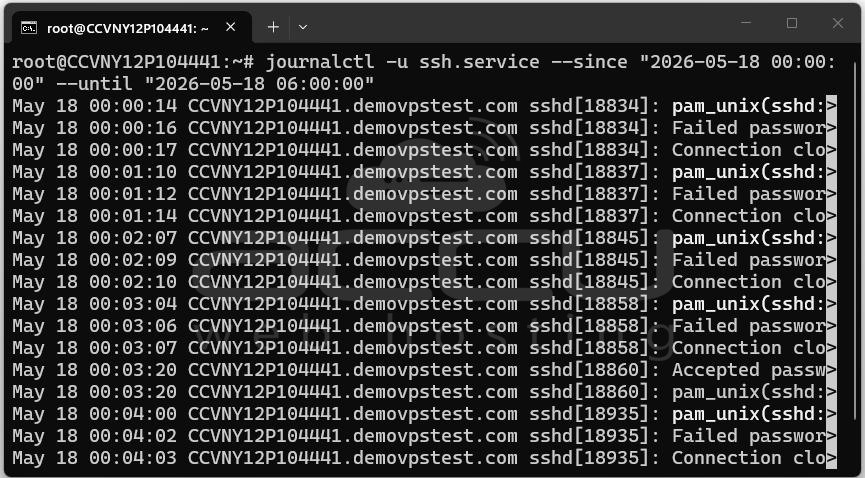
These human-readable expressions make it easy to zero in on a specific window without calculating exact timestamps. Combine time filters with unit filters for precise queries:
journalctl -u mysql.service --since "2026-05-18 00:00:00" --until "2026-05-18 06:00:00"
Operation 7: Filtering by Process, User, or Group
You can filter journal entries by the PID, UID, or GID of the process that generated them.
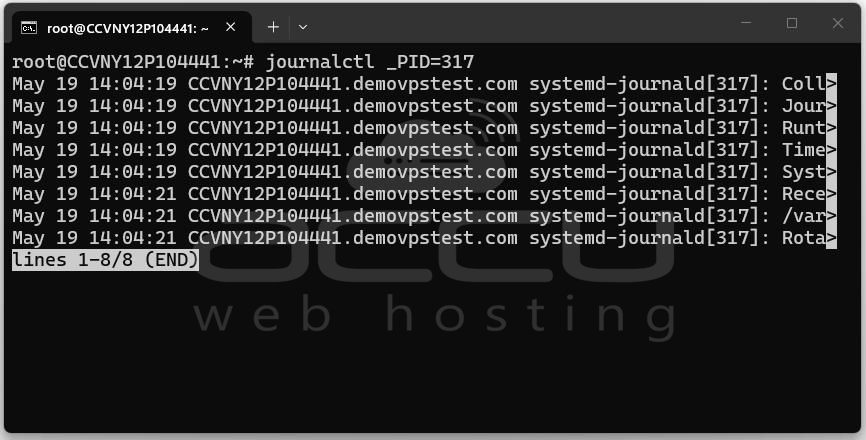
Filter by PID:
journalctl _PID=317
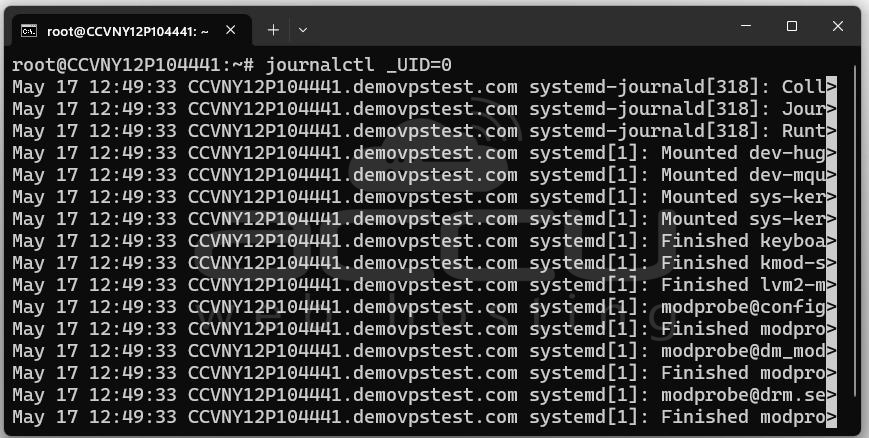
Filter by UID (user ID):
journalctl _UID=1000
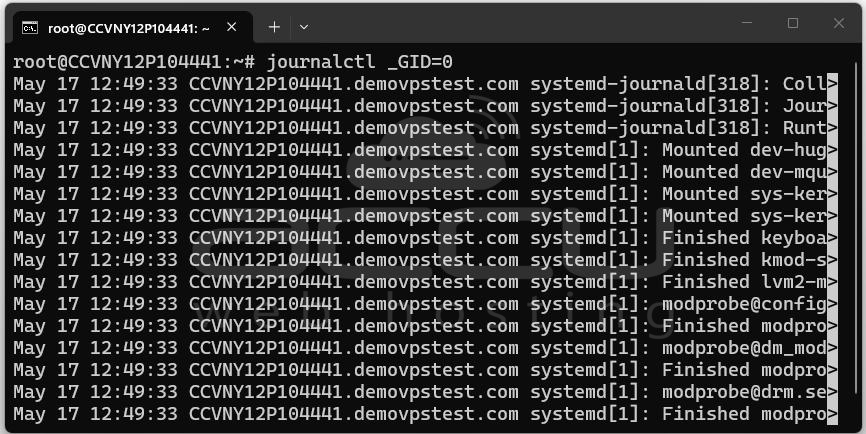
Filter by GID (group ID):
journalctl _GID=1000
Find your UID:
id -u youruser
View all logs generated by the www-data user (common for web servers):
journalctl _UID=$(id -u www-data)
Operation 8: Filtering by Kernel Messages
To view only kernel messages (equivalent to dmesg):
journalctl -k
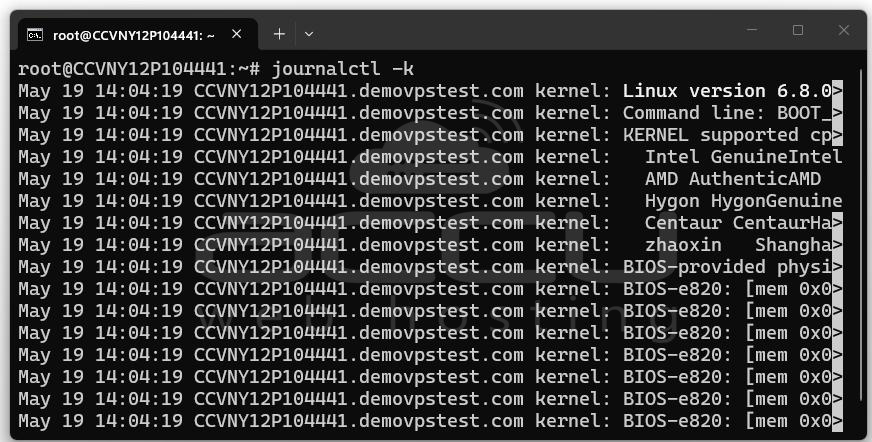
This is useful for hardware issues, driver errors, OOM (out of memory) kills, and filesystem errors.
Kernel messages from the previous boot:
journalctl -k -b -1
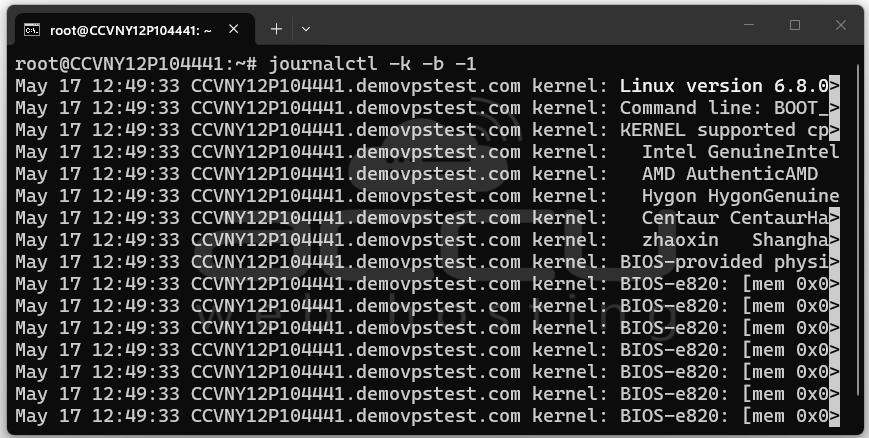
Kernel messages since the last hour:
journalctl -k --since "1 hour ago"
Operation 9: Output Formats
By default, journalctl outputs in a human-readable format. However, the journal stores rich structured data, and you can request different output formats using the -o flag.
Short format (default):
journalctl -o short
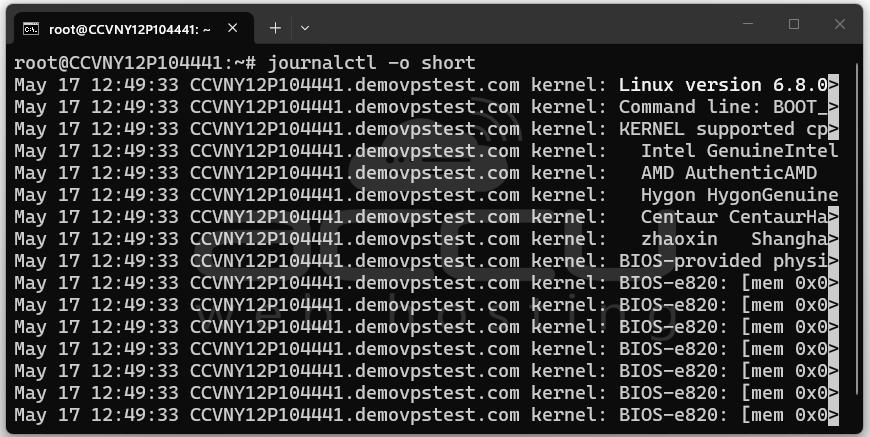
Verbose format — shows all metadata fields:
journalctl -o verbose
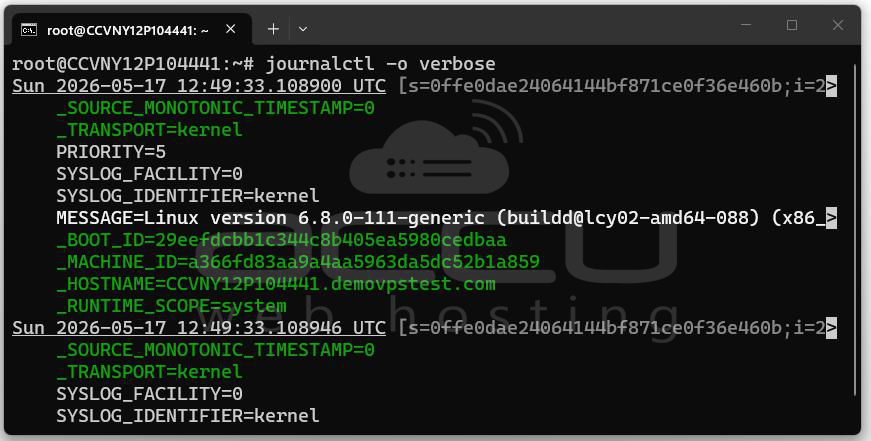
Output includes fields like _HOSTNAME, _TRANSPORT, _SYSTEMD_UNIT, _COMM, PRIORITY, and many more.
JSON format — one JSON object per line:
journalctl -o json
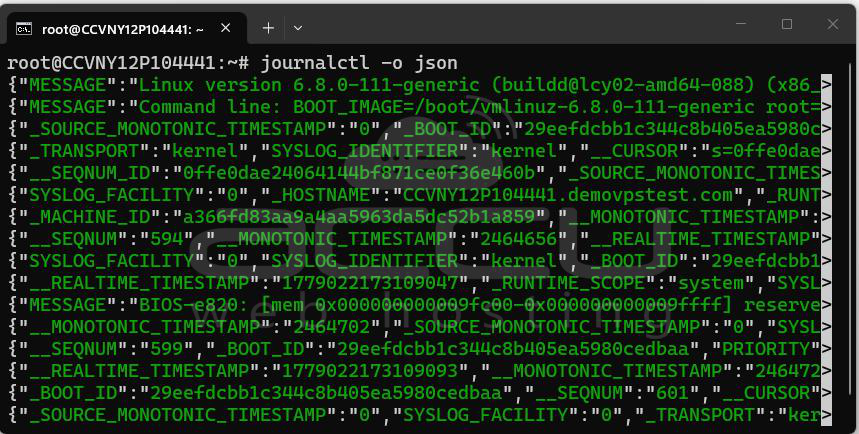
Pretty-printed JSON:
journalctl -o json-pretty
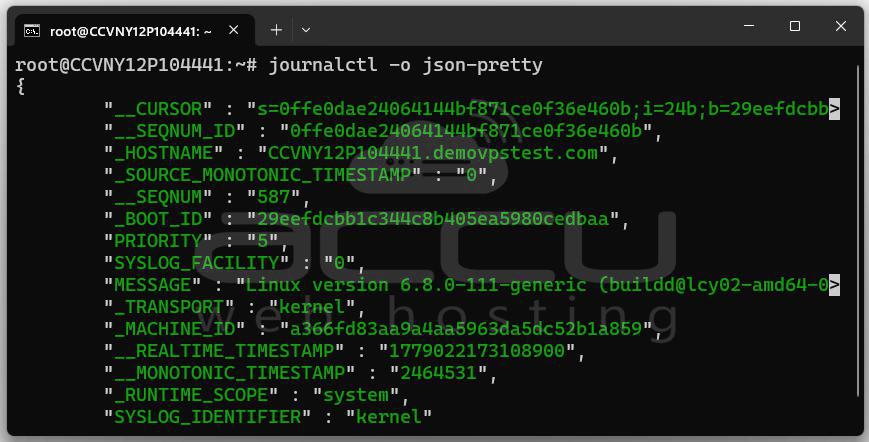
JSON output is invaluable for log ingestion pipelines. You can pipe it to jq for further processing:
journalctl -o json | jq '.MESSAGE'
journalctl -u nginx.service -o json | jq '{time: .__REALTIME_TIMESTAMP, msg: .MESSAGE}'
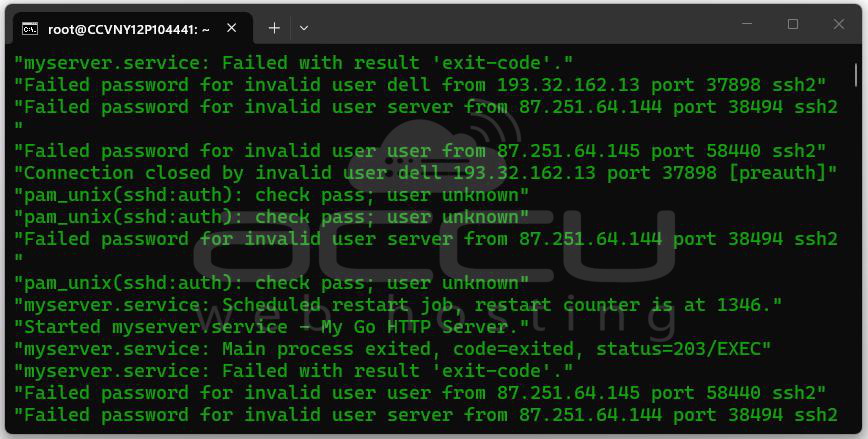
Cat format — message text only:
journalctl -o cat
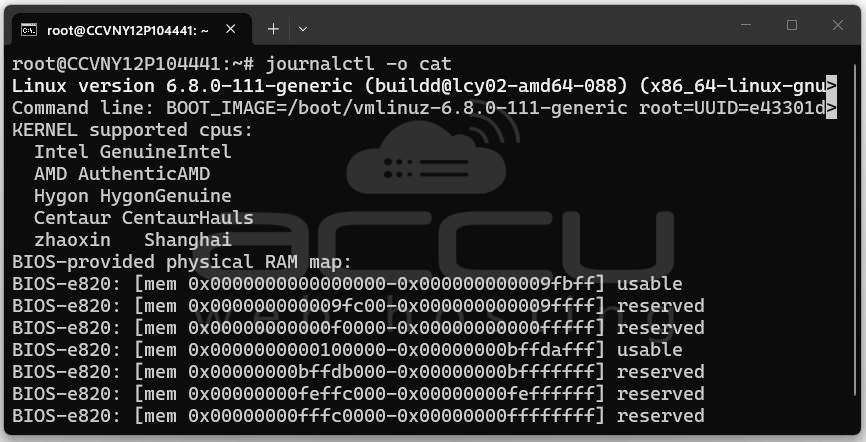
Useful when you only want the raw message text without timestamps or hostnames.
Export format — for backup/transfer:
journalctl -o export > journal-backup.export
Operation 10: Searching Logs with grep
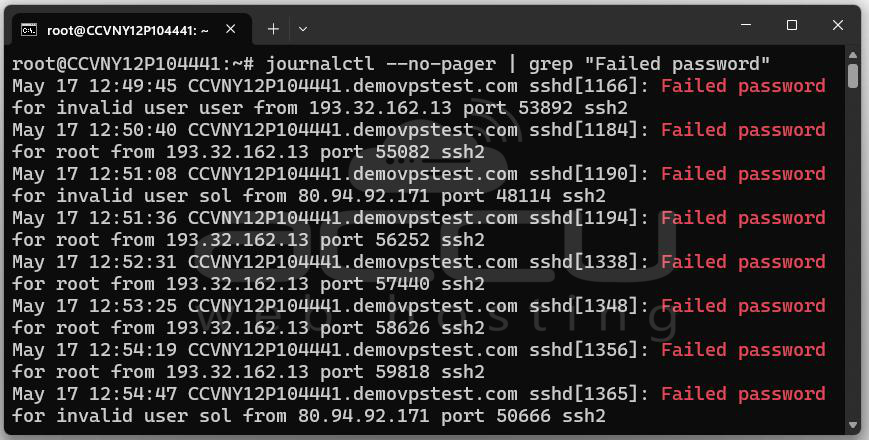
Since journalctl --no-pager outputs plain text, you can combine it with grep for pattern matching:
journalctl --no-pager | grep "Failed password"
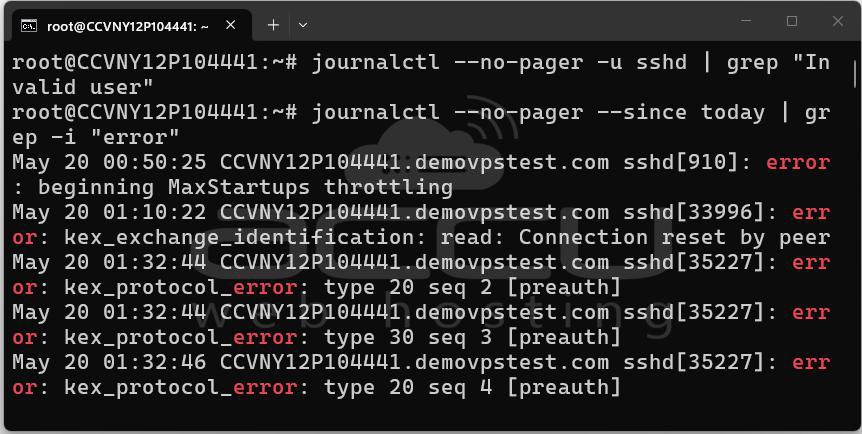
journalctl --no-pager -u sshd | grep "Invalid user"
journalctl --no-pager --since today | grep -i "error"
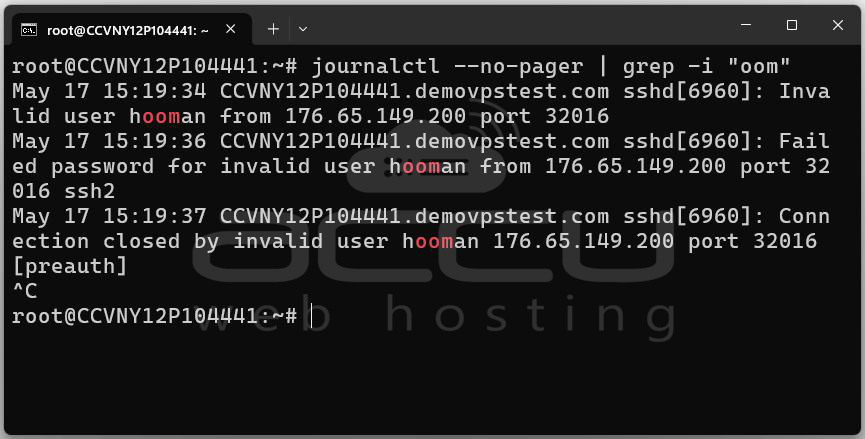
For case-insensitive matching:
journalctl --no-pager | grep -i "oom"
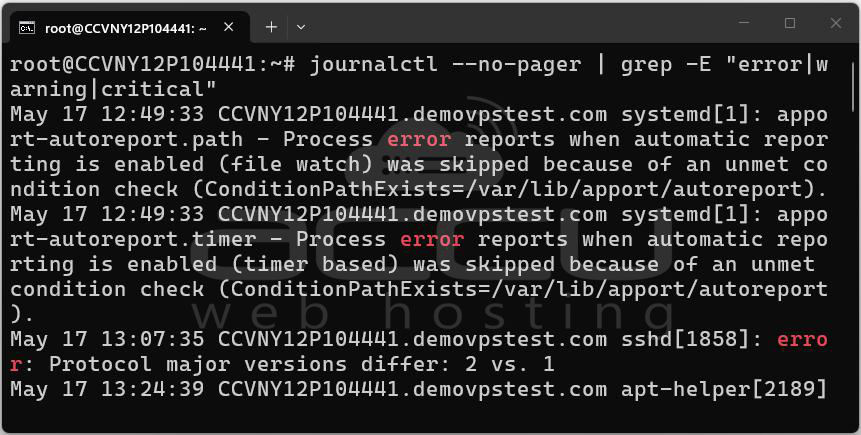
For multiple patterns:
journalctl --no-pager | grep -E "error|warning|critical"
Conclusion
journalctl is one of the most powerful and versatile log management tools available on modern Linux systems. Unlike scattered text log files, the systemd journal gives you a single, structured, indexed source of truth for everything that happens on your server, from the very first kernel message at boot to every line written by your applications.