Understanding CPU Steal Time on Virtual Machines
In virtualization, keeping track of performance is important to make sure resources are used efficiently. One important factor that is often overlooked but can greatly impact how virtual machines (VMs) perform is CPU Steal Time. It’s essential to understand what CPU Steal Time is, how it can slow down VMs, and how to monitor it, especially for anyone managing virtualized systems.
What is CPU Steal Time?
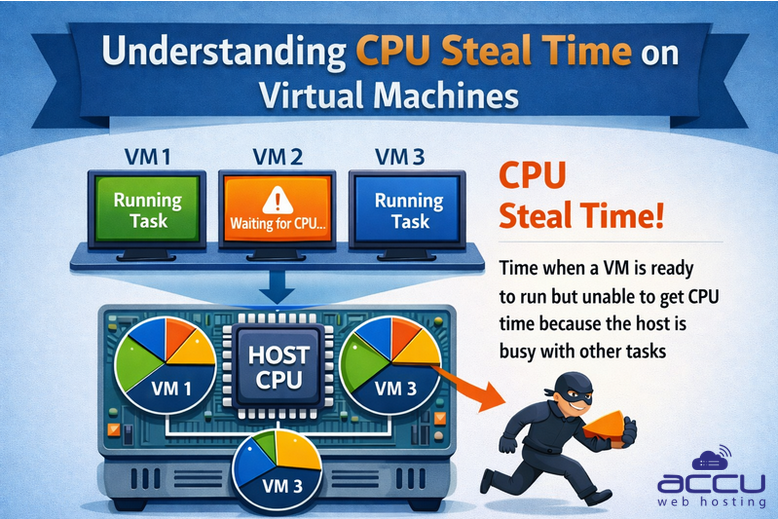
CPU Steal Time occurs when a virtual machine (VM) is ready to execute a task but is unable to do so because the physical host machine (the hypervisor) is busy processing tasks for other VMs or system processes. In essence, CPU steal time represents the amount of CPU resources a VM was supposed to have access to but couldn’t, because the host's CPU resources were already being used elsewhere.
Imagine the VM is waiting in line for CPU time, but someone cuts ahead of it, stealing the processing time it was supposed to use. This stolen time can lead to a noticeable slowdown in VM performance.
Why Does CPU Steal Time Occur?
CPU Steal Time typically arises due to one or more of the following reasons:
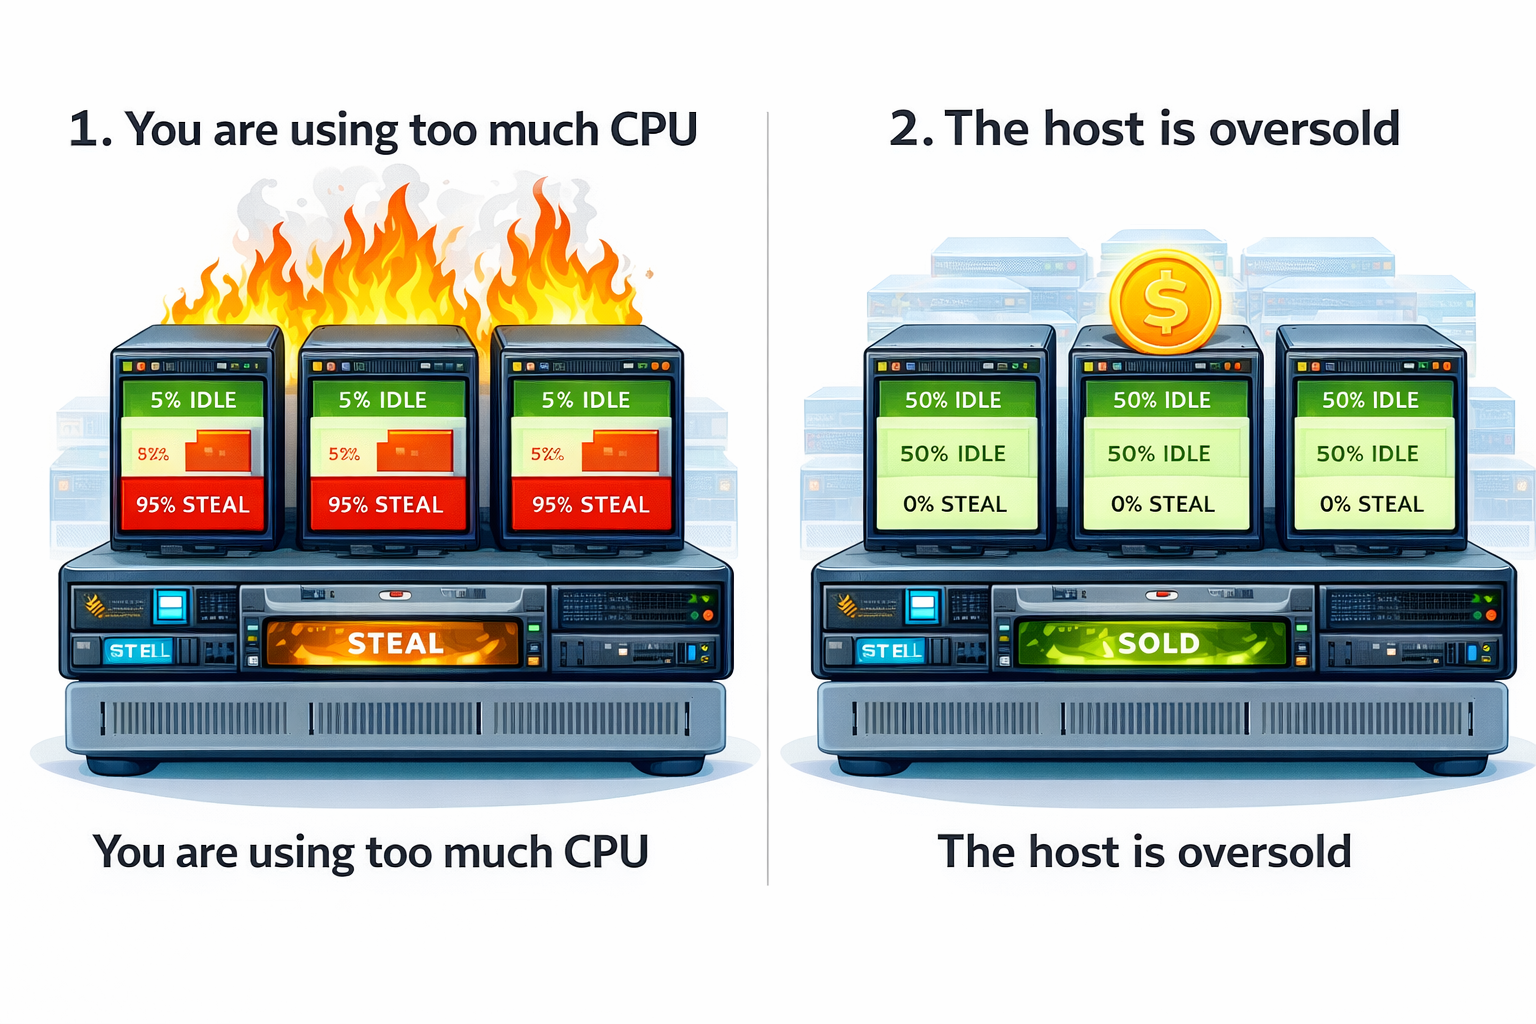
1. Overloaded Host: When the physical server running multiple VMs has insufficient CPU resources to meet the demands of all VMs simultaneously, CPU steal time increases. This happens when the host's CPU is overloaded with requests from too many virtual machines.
2. Resource Contention: VMs on the same host can compete for CPU time. If there isn’t enough CPU power to go around, each VM may experience periods of high steal time.
3. Inefficient Allocation: When VMs are not allocated adequate CPU resources (either due to improper configuration or not matching workload demands), steal time can spike. Proper CPU resource allocation is key to balancing VM performance.
Monitor CPU Steal Time on a Linux VPS
To monitor CPU Steal Time on a Linux VPS, you can use various commands and tools to identify how much of the CPU time is being stolen by the hypervisor. Below are detailed steps to check CPU steal time specifically on Linux-based Virtual Private Servers (VPS) running on hypervisors such as KVM, Xen, or VMware.
Step 1: Connect to your VPS using the following command:
ssh username@your-vps-ip
Replace username with your VPS's username (usually root or a user you created) and your-vps-ip with the IP address of your VPS.
Step 2: Use the top Command to Check CPU Steal Time. The top command is a simple and effective tool to monitor system performance, including CPU steal time. Run the following command to open the top command interface:top
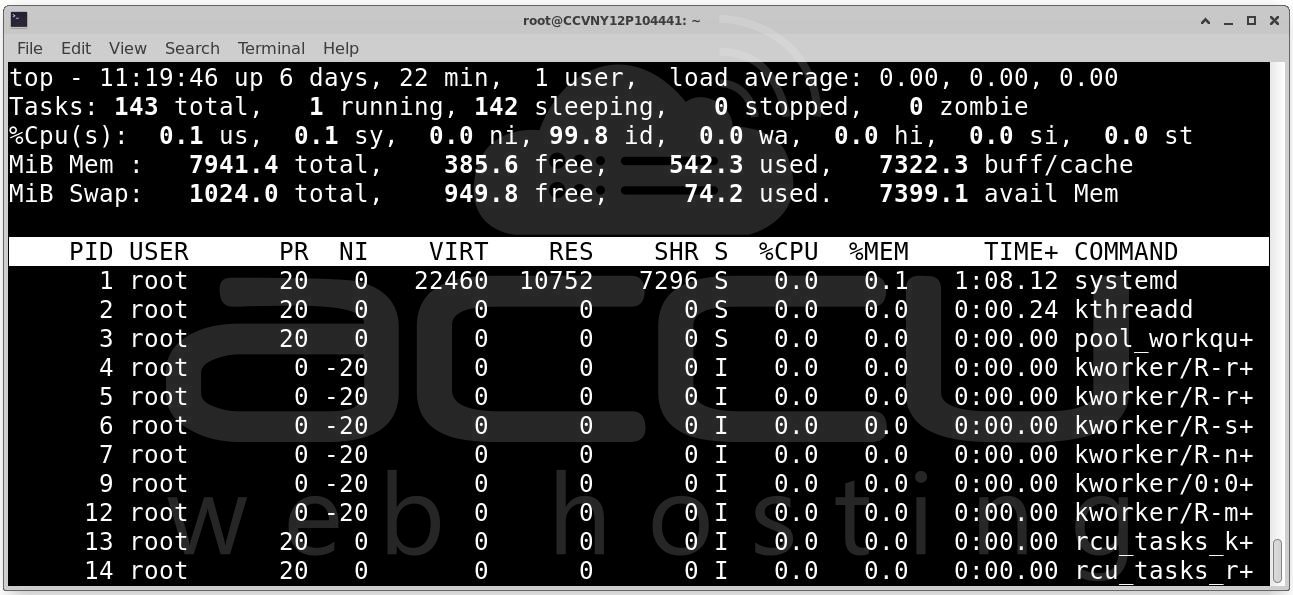
Once you're in top, press 1 on your keyboard to show the statistics for each CPU core (if your VPS has multiple cores).
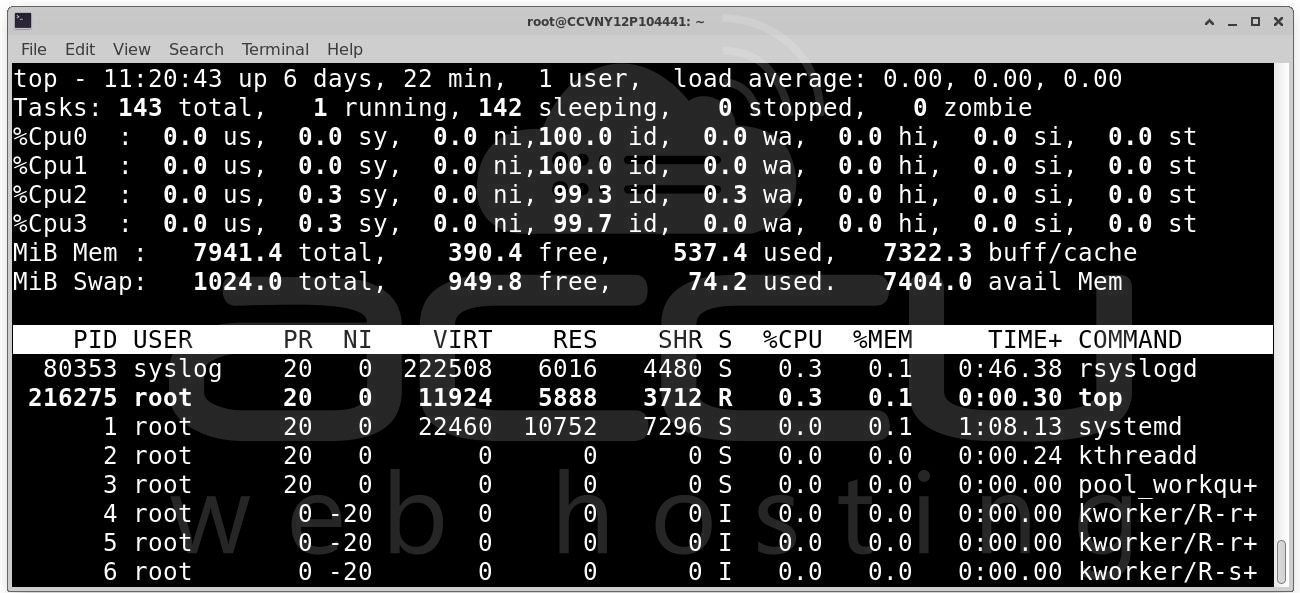
Look for the %st column, which stands for "steal time." This column indicates the percentage of CPU time that the hypervisor is stealing from your VM due to resource contention. %st represents the amount of CPU time that was allocated to other VMs or processes running on the same physical host, preventing your VPS from using it. To exit top, press q.
Step 3: Use the vmstat Command. The vmstat command provides a more detailed snapshot of system performance, including CPU steal time. Run the following command to check for steal time: vmstat 1
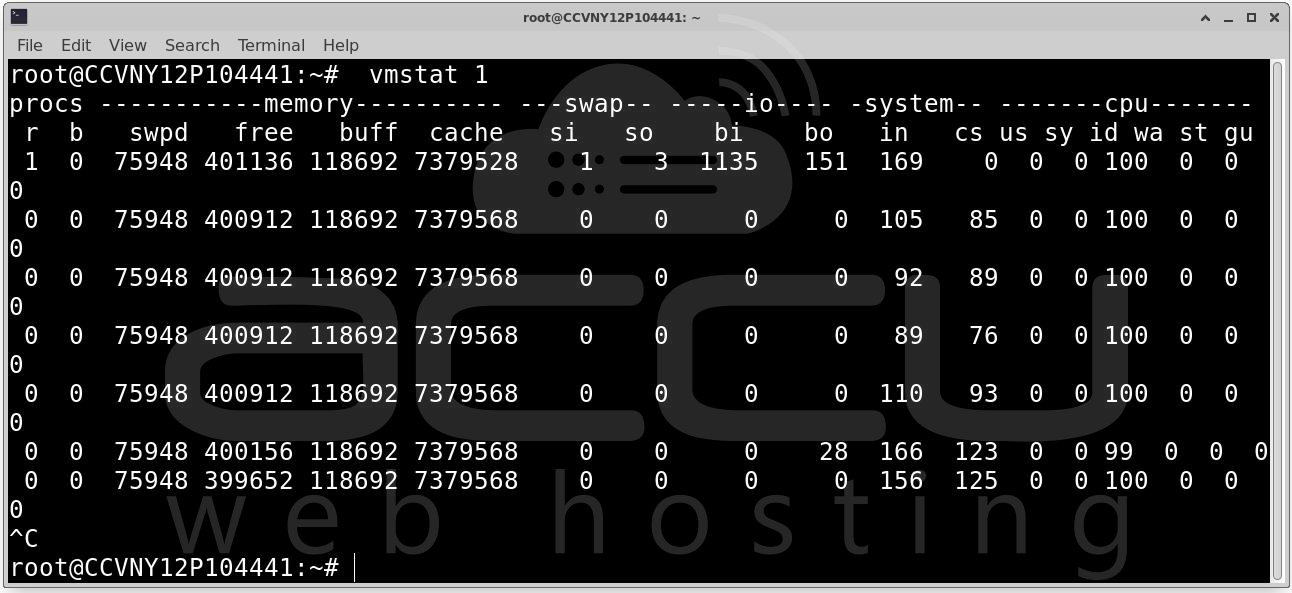
This will display system statistics every second. Look at the st column, which shows the CPU steal time percentage. The st value is what you're looking for here. A high value indicates that your VPS is experiencing significant CPU steal time and is being deprived of processing resources. To stop the continuous output, press Ctrl + C.
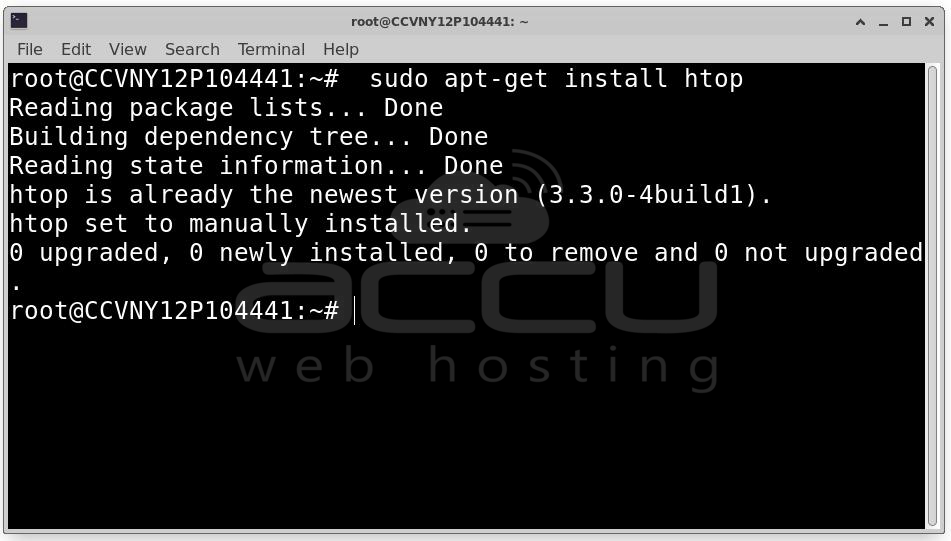
Step 4: Use the htop Command. htop is an enhanced version of top that provides a more user-friendly, color-coded display. It also shows CPU steal time in a more visually appealing way. Install htop if it isn't already installed. You can install it by running: sudo apt-get install htop # For Debian/Ubuntu-based systems
sudo yum install htop # For CentOS/RedHat-based systems
Once installed, run htop: htop
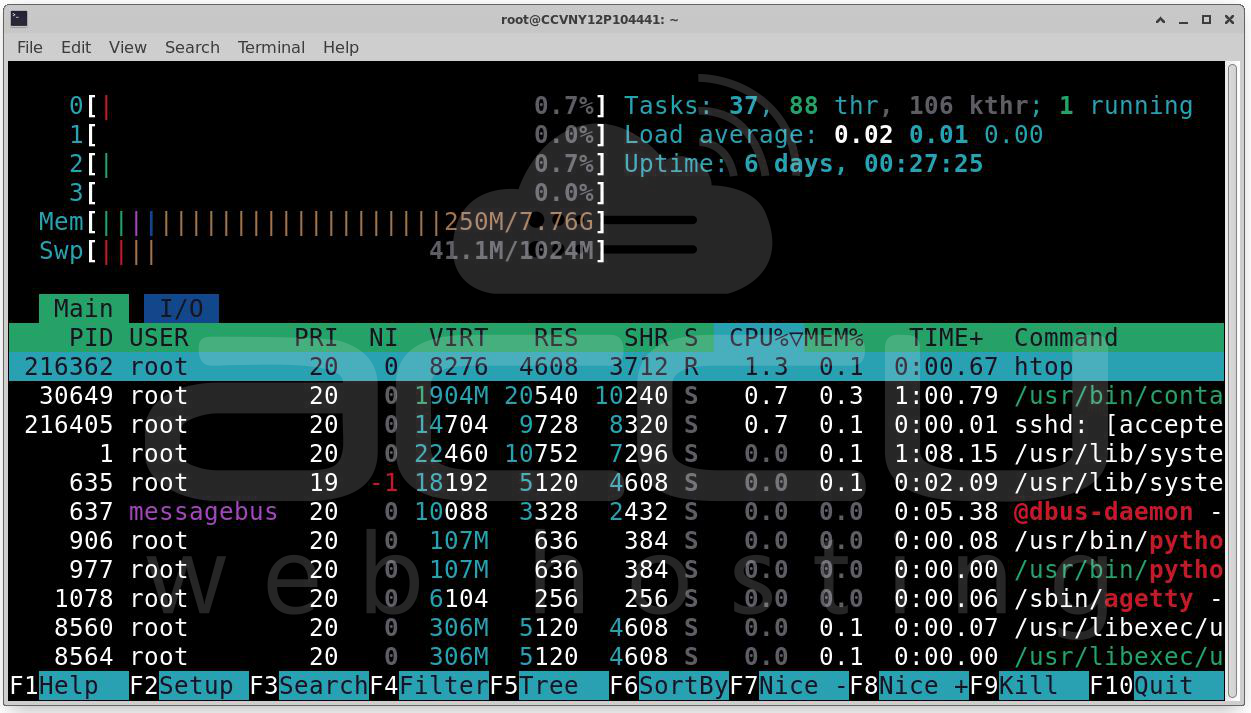
In the htop interface, you should see a CPU usage graph for each CPU core. At the bottom, look for a column labeled "st", which represents CPU steal time. To highlight CPU steal time, you can also customize the htop display:
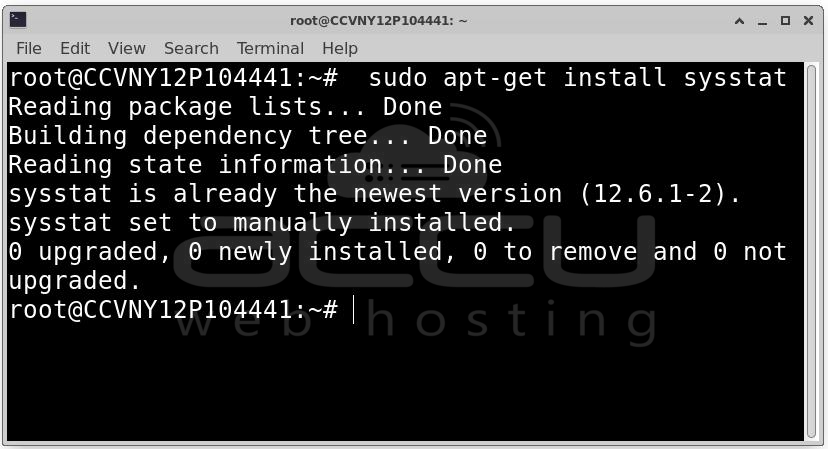
Step 5: Use the mpstat Command. The mpstat command, part of the sysstat package, can also be used to monitor CPU performance, including steal time.
If mpstat is not already installed, you can install it: sudo apt-get install sysstat # For Debian/Ubuntu-based systems
sudo yum install sysstat # For CentOS/RedHat-based systems
Run the following command to display CPU statistics: mpstat -P ALL 1
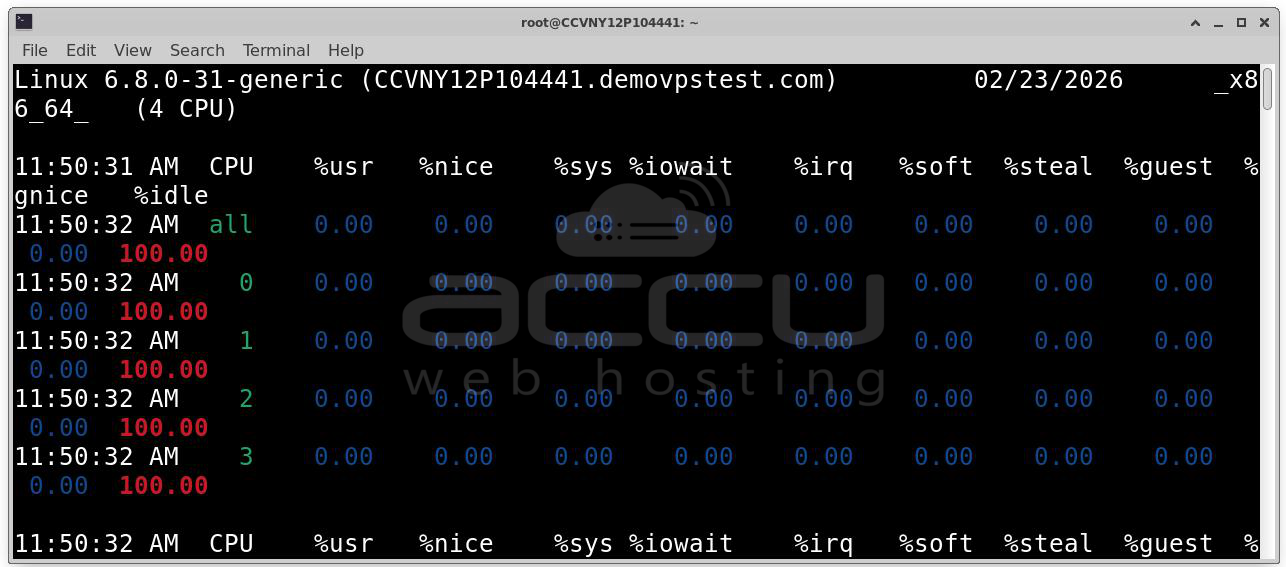
This will show detailed statistics for all CPU cores, including the %steal column, which represents the CPU steal time. Look at the %steal column. If this value is high, it means your VPS is waiting for CPU resources, which could affect performance.
Step 6: Use sar for Historical Data. If you want to track CPU steal time over a longer period, the sar command is useful for historical data analysis.
Use the following command to collect data on CPU performance, including steal time: sar -u 1 10
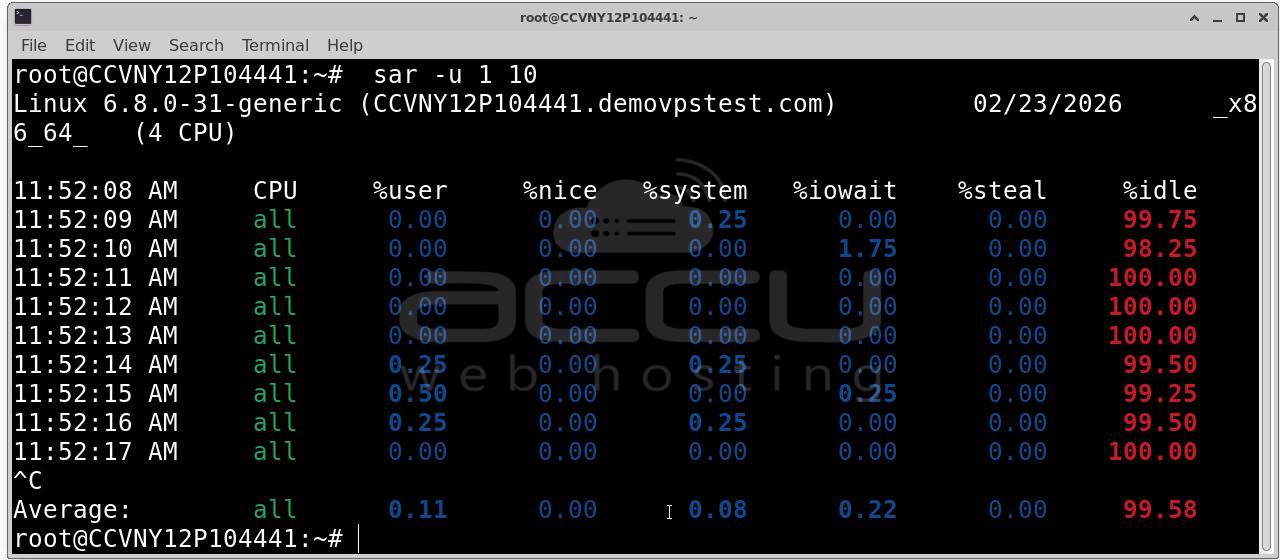
This will report CPU usage statistics every 1 second, 10 times. You can see the %steal column in the output. If you want to track steal time for a longer period, you can use sar to collect data at regular intervals and later analyze the results.
Step 7: Check the dmesg Logs (Optional). Sometimes, dmesg logs can provide information related to resource contention and other performance issues. This is more of a diagnostic tool than a real-time monitor. Run the following command to view the system's message buffer:dmesg | grep -i steal
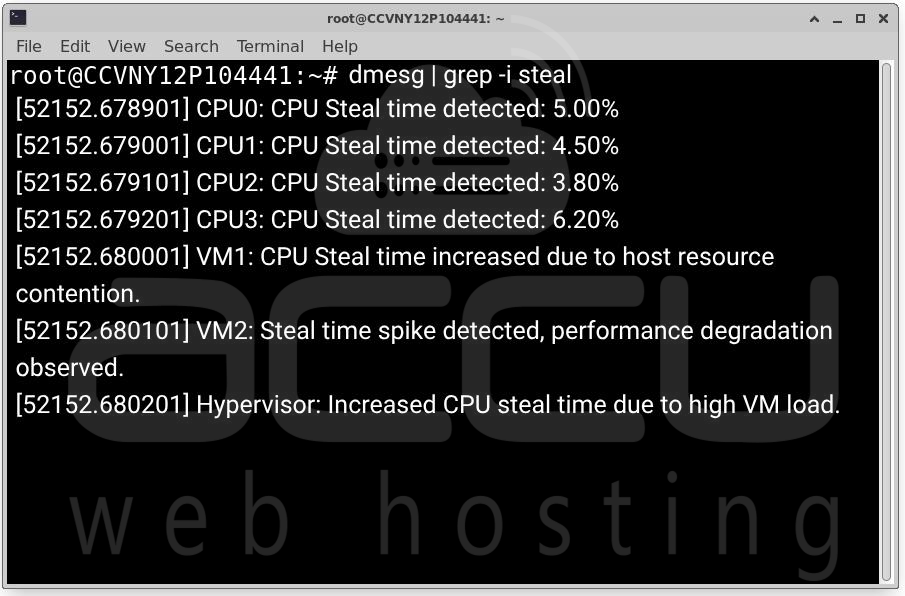
If there are any related messages regarding CPU steal time or resource contention, they will be shown here.
Tools to Monitor and Reduce CPU Steal Time
Several third-party tools can help monitor and mitigate high CPU steal time, including:
1. Nagios: A popular open-source monitoring tool that provides comprehensive resource monitoring, including CPU steal time.
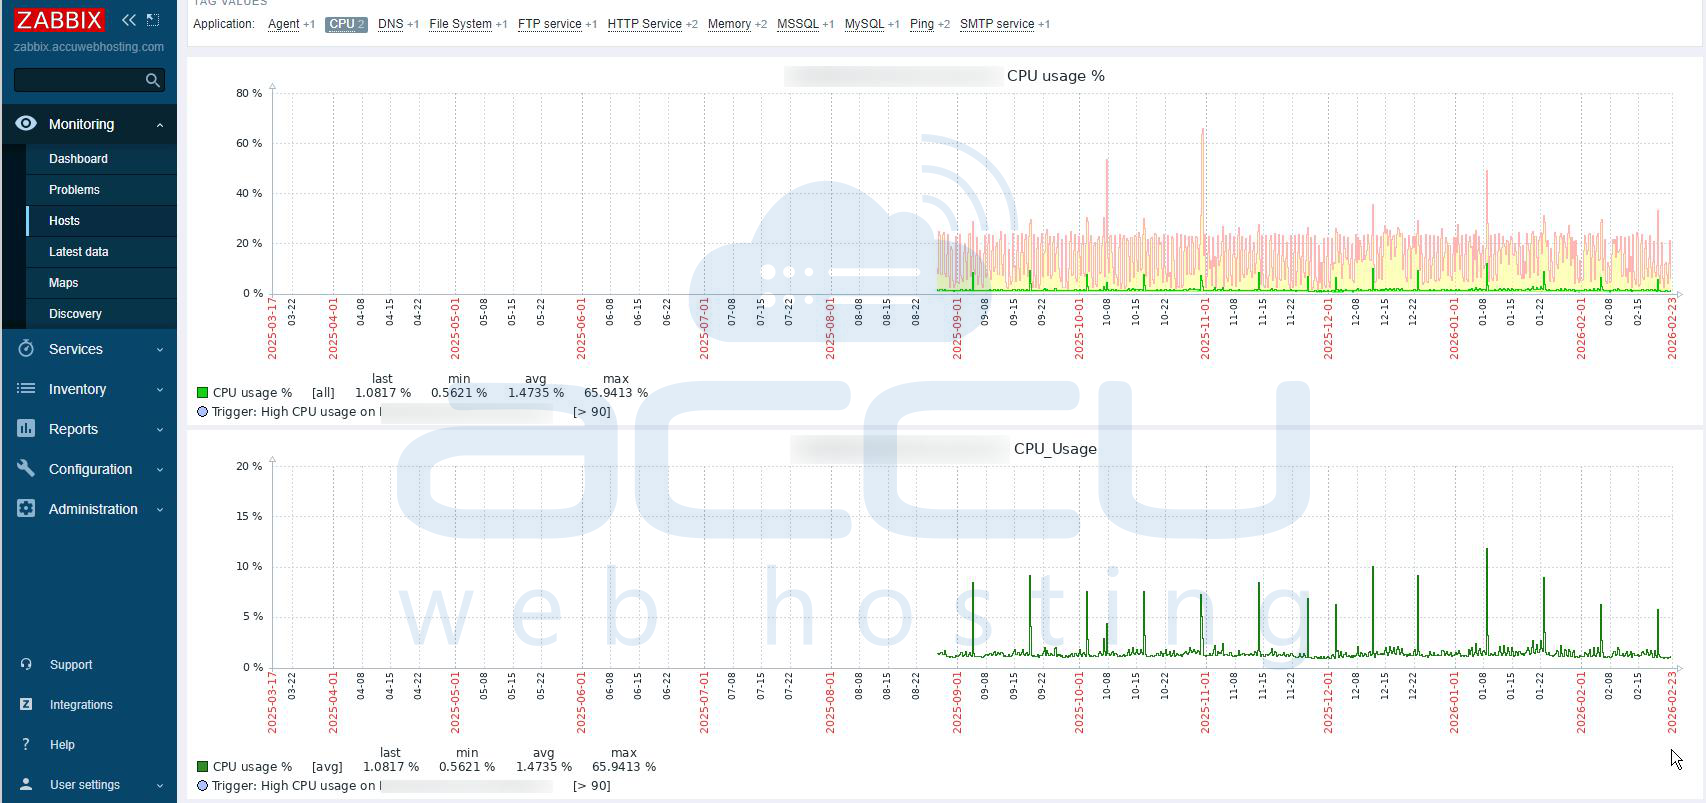
2. Zabbix: Zabbix offers robust monitoring for virtualized environments, including CPU steal time. Zabbix can be customized to track steal time and send alerts when it goes beyond acceptable levels.
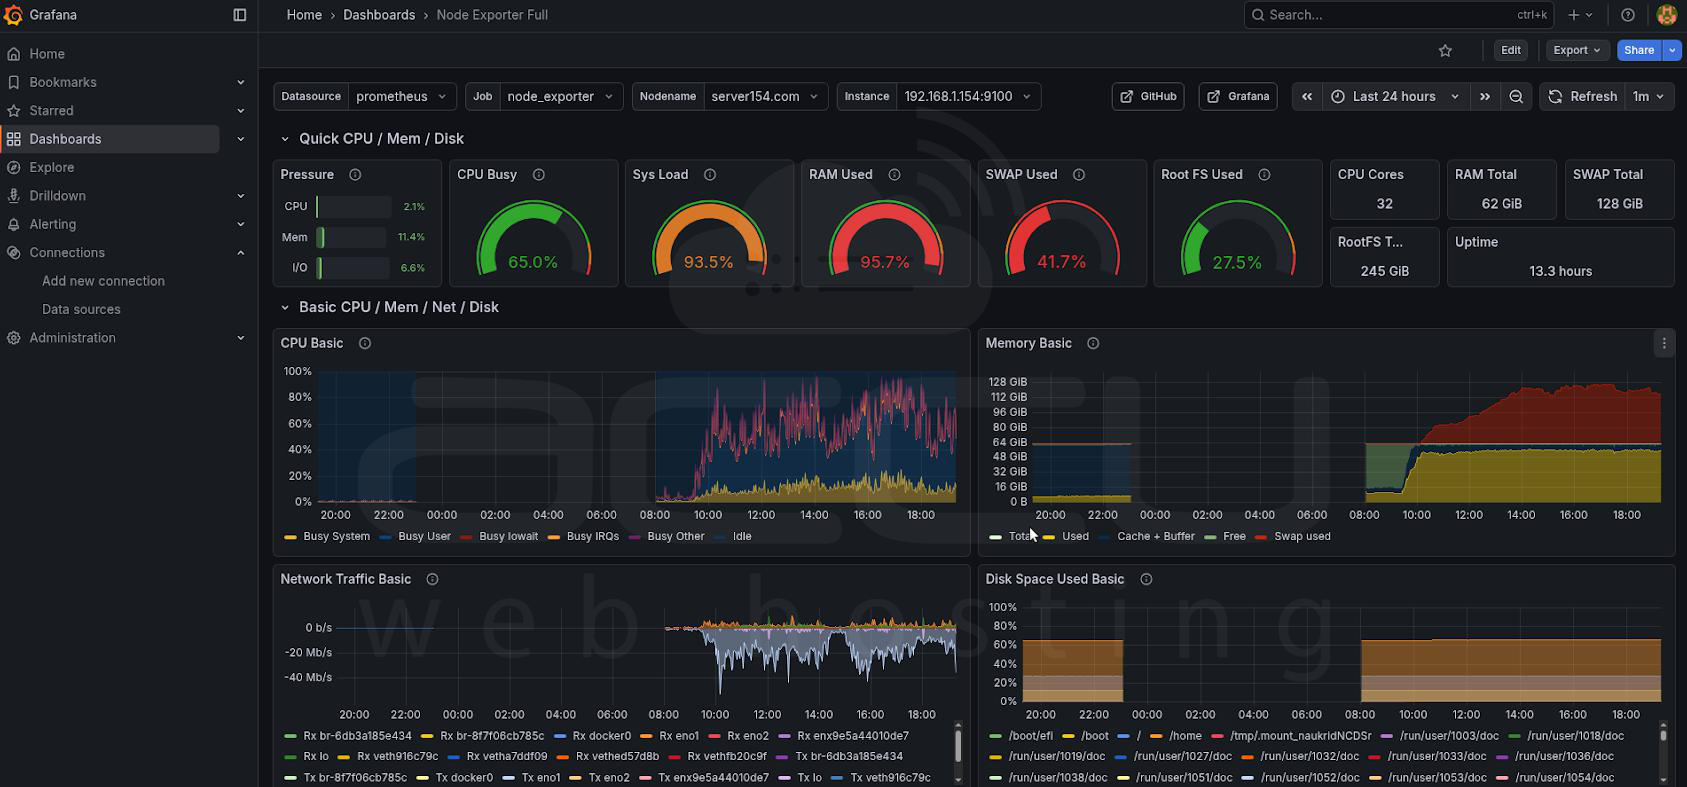
3. Prometheus + Grafana: For more advanced monitoring, Prometheus (a time-series database) combined with Grafana (a visualization tool) can provide detailed insights into CPU steal time. By configuring Prometheus to scrape data from your hypervisors, you can set up dashboards to visualize CPU steal time.
How to Mitigate High CPU Steal Time?
While monitoring CPU steal time is crucial, addressing the underlying causes can help reduce it:
1. Increase Host Resources: If your host is overloaded, adding more CPU cores or upgrading to a more powerful physical server may be necessary. This ensures that each VM gets adequate access to CPU resources.
2. Resource Allocation Optimization: Ensure VMs are allocated appropriate CPU resources. Avoid over-provisioning VMs with too many virtual CPUs, as this can lead to increased contention.
3. Load Balancing: Distribute workloads evenly across multiple hosts in your cluster. This reduces the chances of one host becoming overloaded and causing high steal time.
4. VMware vSphere DRS: If you’re using VMware, the Distributed Resource Scheduler (DRS) can help automatically balance VM workloads across hosts, reducing the likelihood of CPU contention and stealing time.
Conclusion
Monitoring CPU steal time is key to managing virtual environments well. Whether you're using Linux, VMware, or cloud platforms, there are tools to help you check and reduce CPU steal time. By being proactive and adjusting resource allocation, you can keep your virtual machines running smoothly and avoid slowdowns caused by resource competition.
