Set Up Server Monitoring Using Prometheus and Grafana
Server monitoring is essential for maintaining a stable, reliable, and high-performing infrastructure. Without proper monitoring, performance problems such as high CPU usage, memory leaks, or disk saturation are often detected only after applications start failing. Prometheus and Grafana are widely used open-source tools that work together to provide real-time visibility into server health. Prometheus collects and stores system metrics, while Grafana turns that data into clear and interactive dashboards. This tutorial explains how to install Prometheus and Grafana, connect them, and use ready-made dashboards to monitor your server effectively.
Understanding Prometheus and Grafana
Before starting the installation, it is important to understand the role of each tool and how they complement each other.
What Is Prometheus?
Prometheus is an open-source monitoring and alerting system designed for collecting time-series data. It pulls metrics from monitored targets at regular intervals and stores them locally. Typical metrics include:
- CPU usage
- Memory consumption
- Disk I/O
- Network throughput
Because Prometheus stores historical data, it allows you to analyze trends over time and detect issues before they become critical.
What Is Grafana?
Grafana is a visualization and analytics platform. It connects to data sources such as Prometheus and displays metrics using dashboards made up of graphs, charts, and gauges. Instead of interpreting raw metric values, administrators can visually monitor system performance in real time.
Grafana makes monitoring easier by presenting complex data in a clear and readable format.
Benefits of Using Prometheus and Grafana Together
Using Prometheus and Grafana together provides several advantages:
- Real-time server performance monitoring
- Long-term historical data analysis
- Custom dashboards and alerts
- Early detection of system issues
- Better resource usage planning and optimization
Steps to set Up Server Monitoring Using Prometheus and Grafana
Step 1: Install Prometheus and Node Exporter. Prometheus acts as the monitoring backend, while Node Exporter exposes system-level metrics from the server.
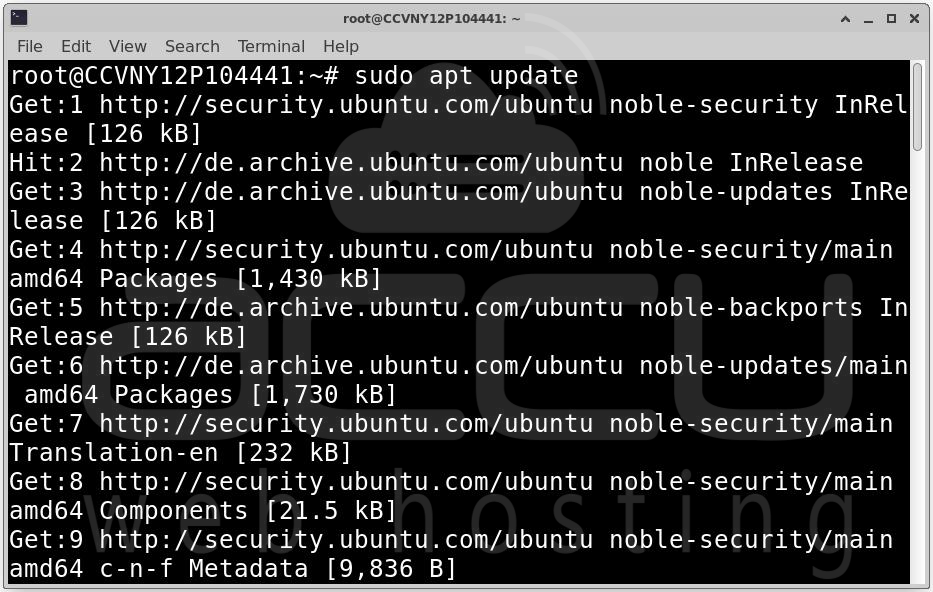
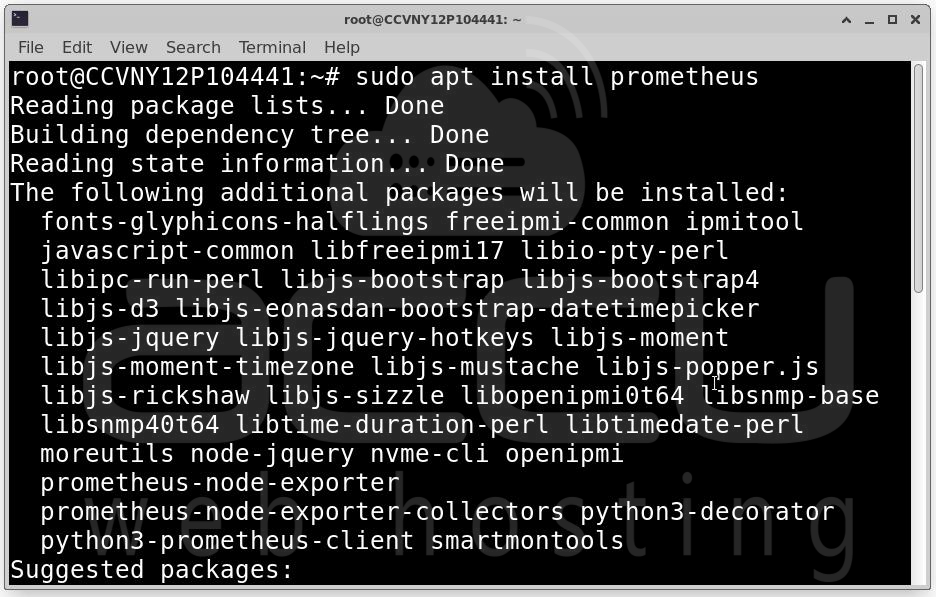
First, update the package list and install Prometheus:
sudo apt update
sudo apt install prometheus
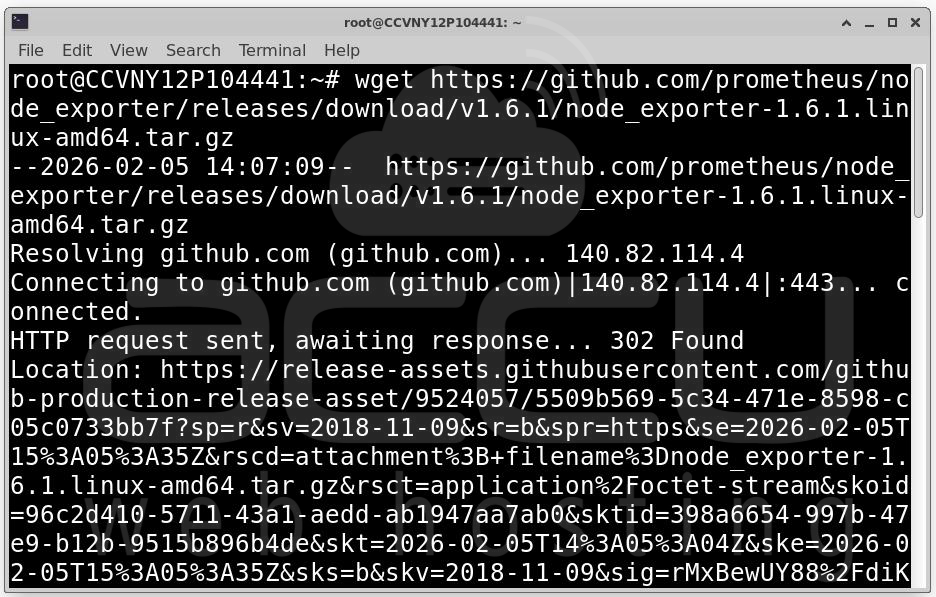
Next, install Node Exporter:
wget https://github.com/prometheus/node_exporter/releases/download/v1.6.1/node_exporter-1.6.1.linux-amd64.tar.gz
tar xvfz node_exporter-1.6.1.linux-amd64.tar.gz
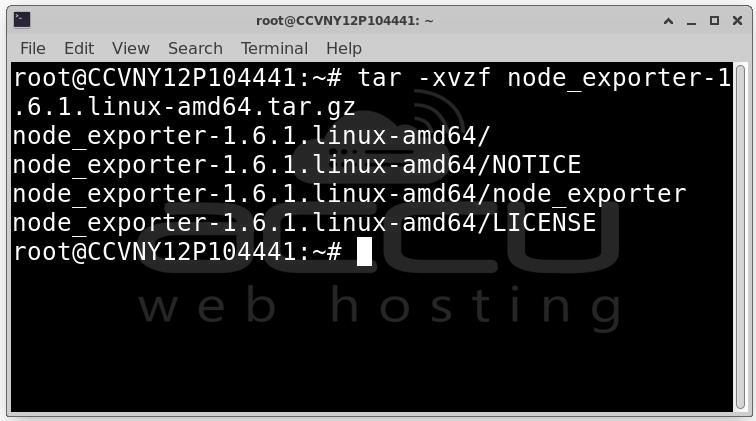
cd node_exporter-1.6.1.linux-amd64
./node_exporter
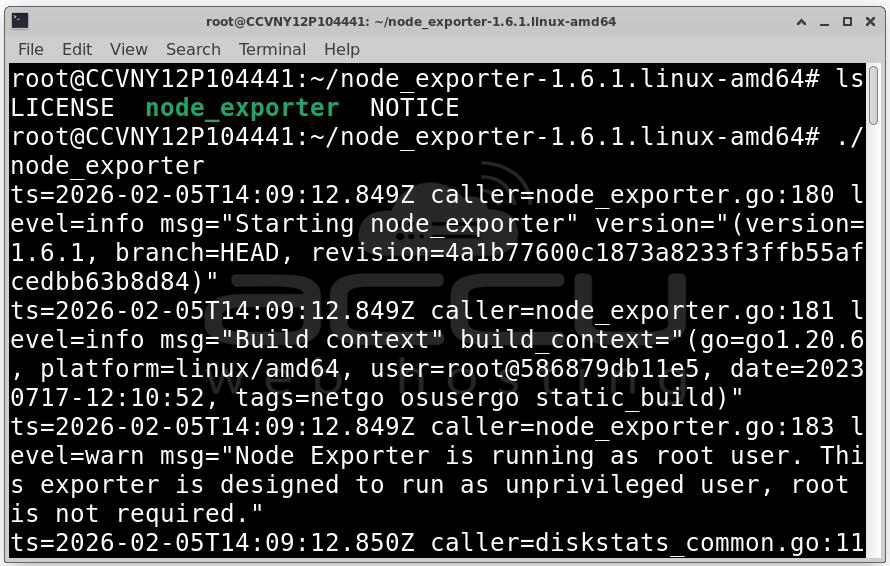
Node Exporter runs on port 9100 and exposes system metrics.
To verify it is working, open the following URL in your browser:
http://your-server-ip:9100/metrics
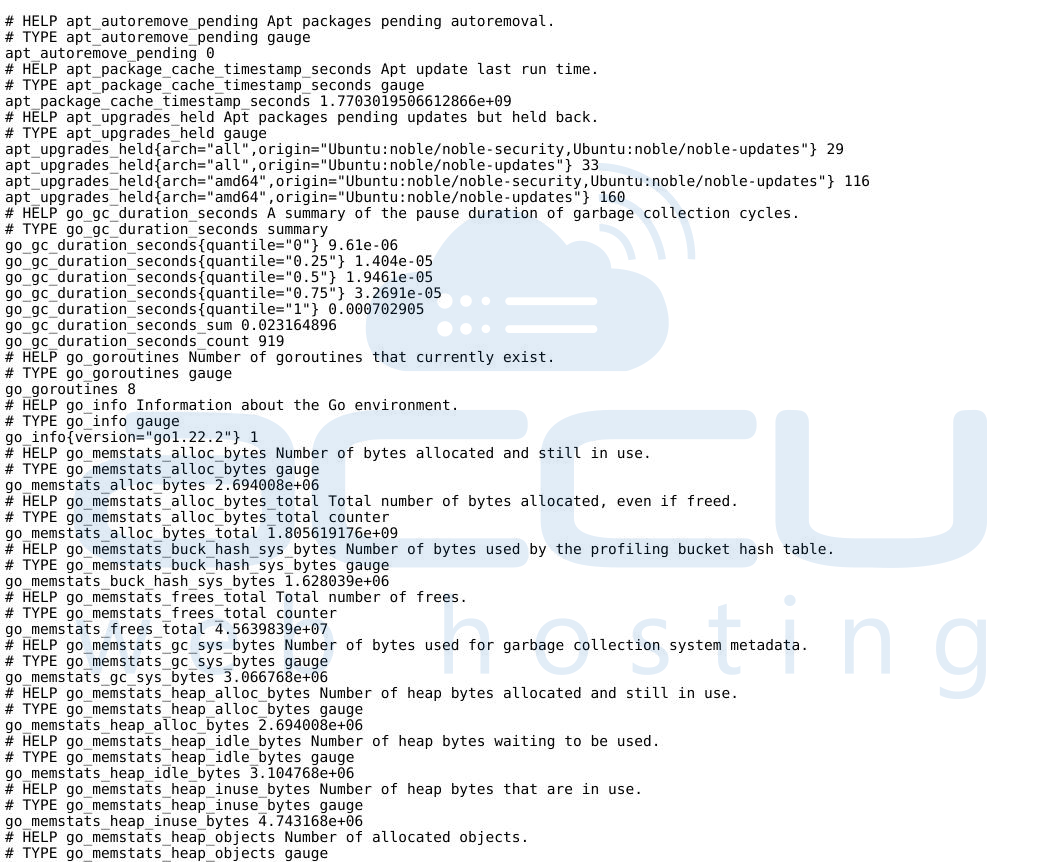
If metrics are displayed, Node Exporter is running correctly.
Step 2: Configure Prometheus to Collect Metrics. Prometheus must be configured to scrape metrics from Node Exporter.
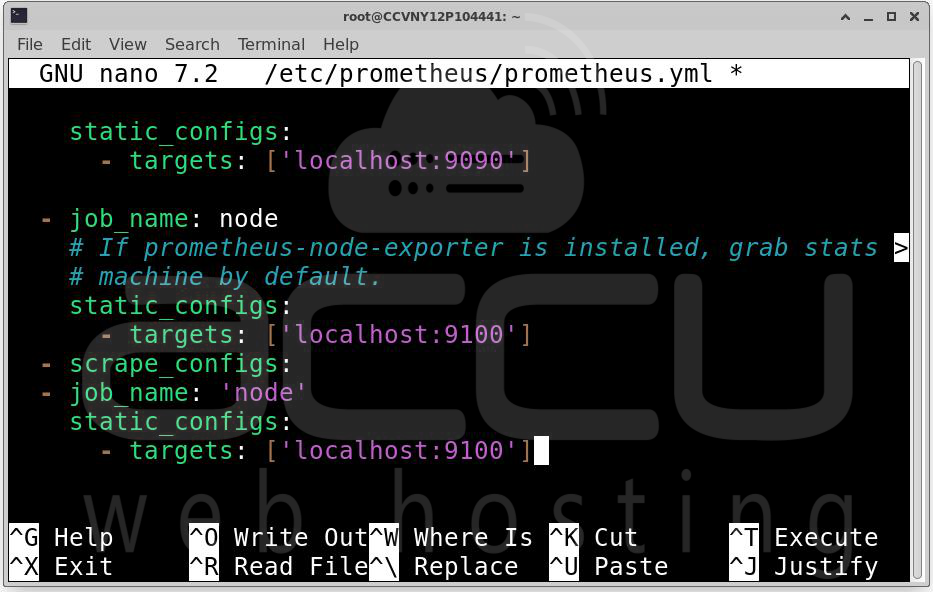
Open the Prometheus configuration file:
sudo nano /etc/prometheus/prometheus.yml
Add the following scrape configuration:
scrape_configs:
- job_name: 'node'
static_configs:
- targets: ['localhost:9100']
Save the file and restart Prometheus:
sudo systemctl restart prometheus
sudo systemctl enable prometheus
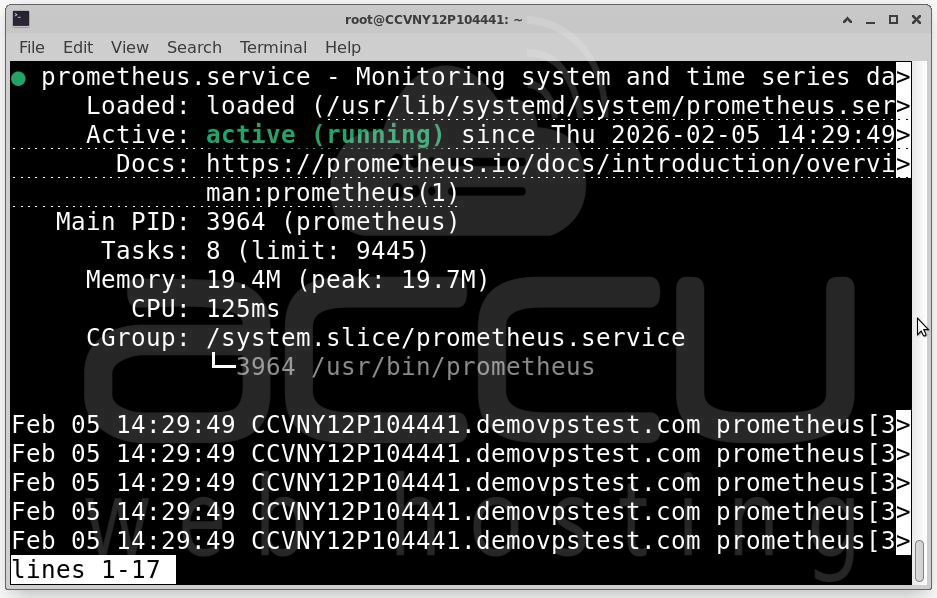
Prometheus will now collect metrics from Node Exporter at regular intervals.
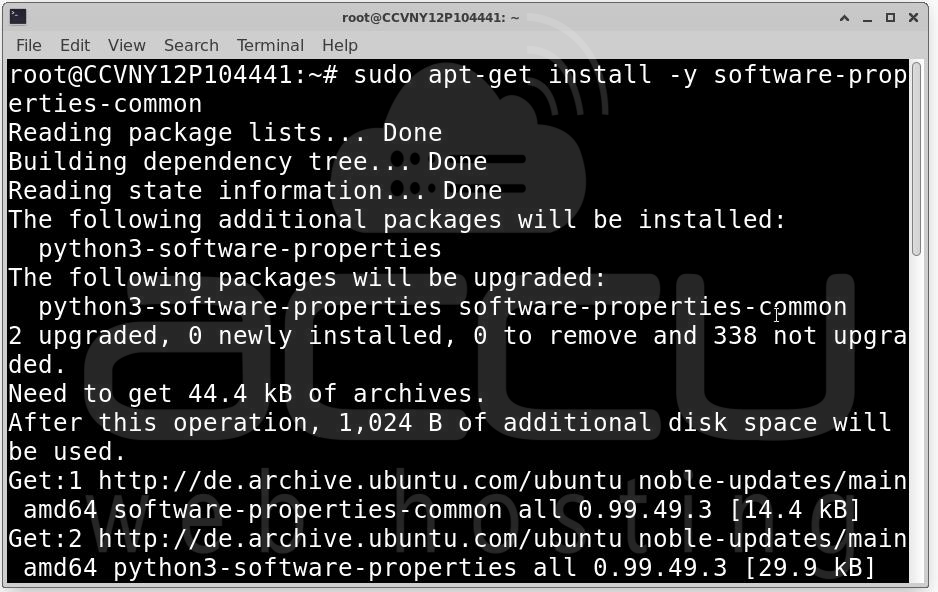
Step 3: Install and Configure Grafana. Grafana is used to visualize the metrics collected by Prometheus. Install required packages and add the Grafana repository:
sudo apt-get install -y software-properties-common
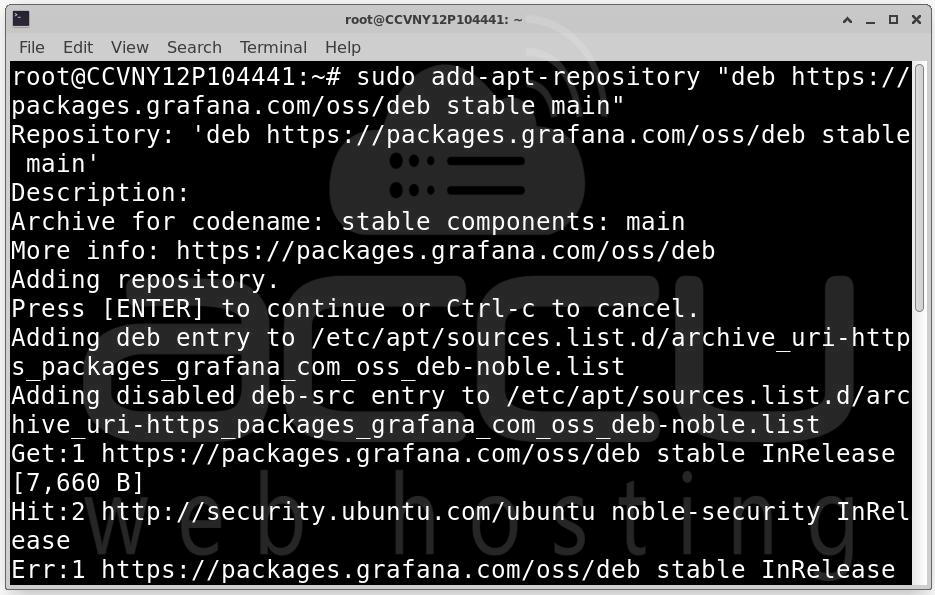
sudo add-apt-repository "deb https://packages.grafana.com/oss/deb stable main"
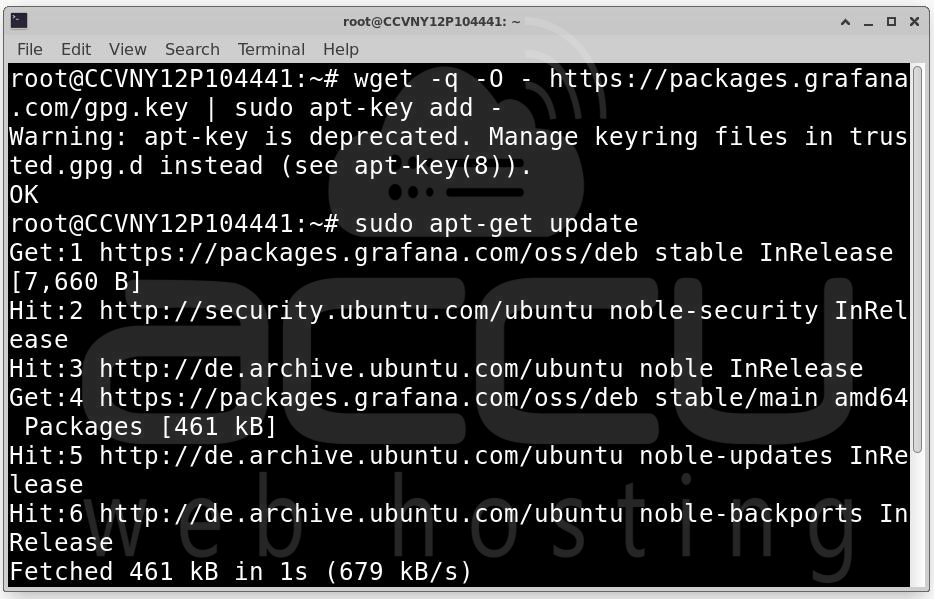
wget -q -O - https://packages.grafana.com/gpg.key | sudo apt-key add -
sudo apt-get update
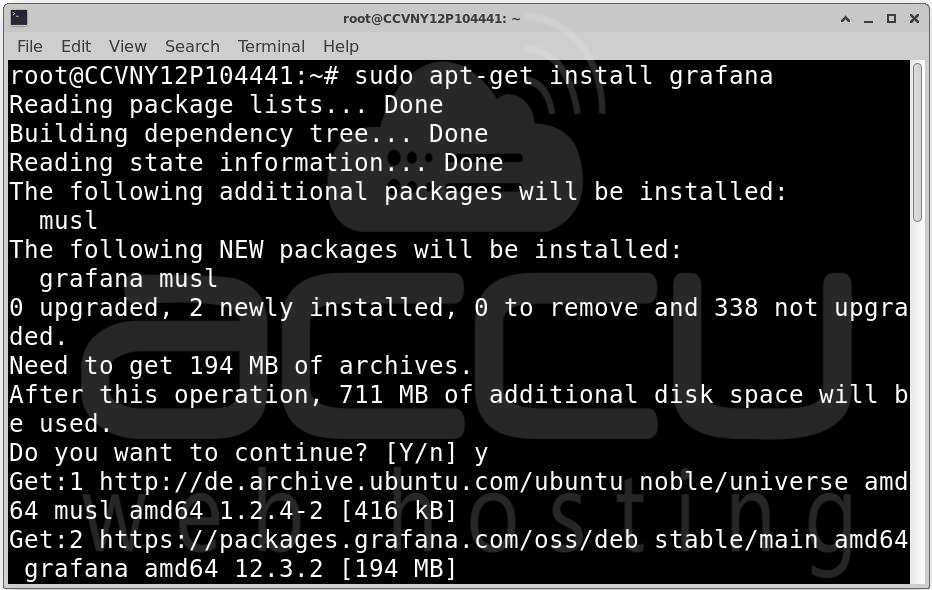
sudo apt-get install grafana
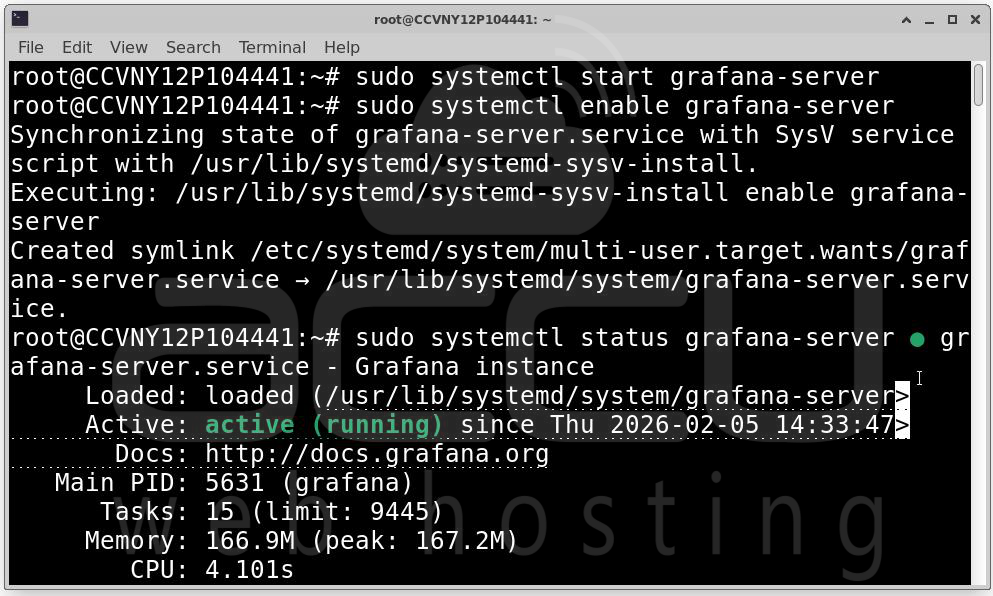
Start Grafana and enable it at boot:
sudo systemctl start grafana-server
sudo systemctl enable grafana-server
Open Grafana in your browser:
http://your-server-ip:3000
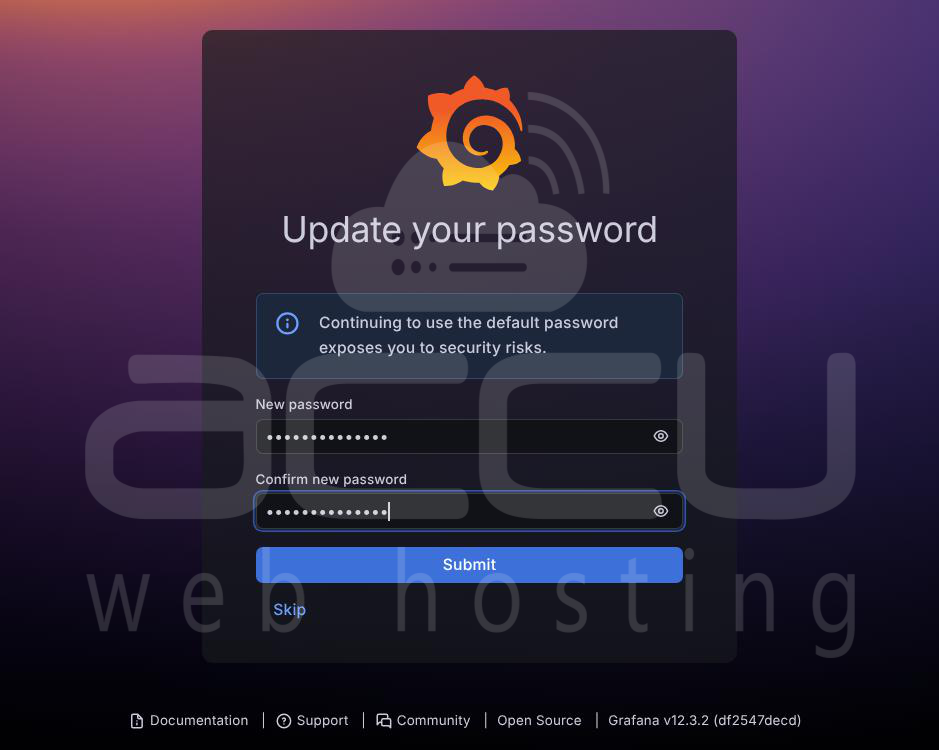
Log in with the default credentials:
- Username: admin
- Password: admin

You will be prompted to set a new password after the first login.
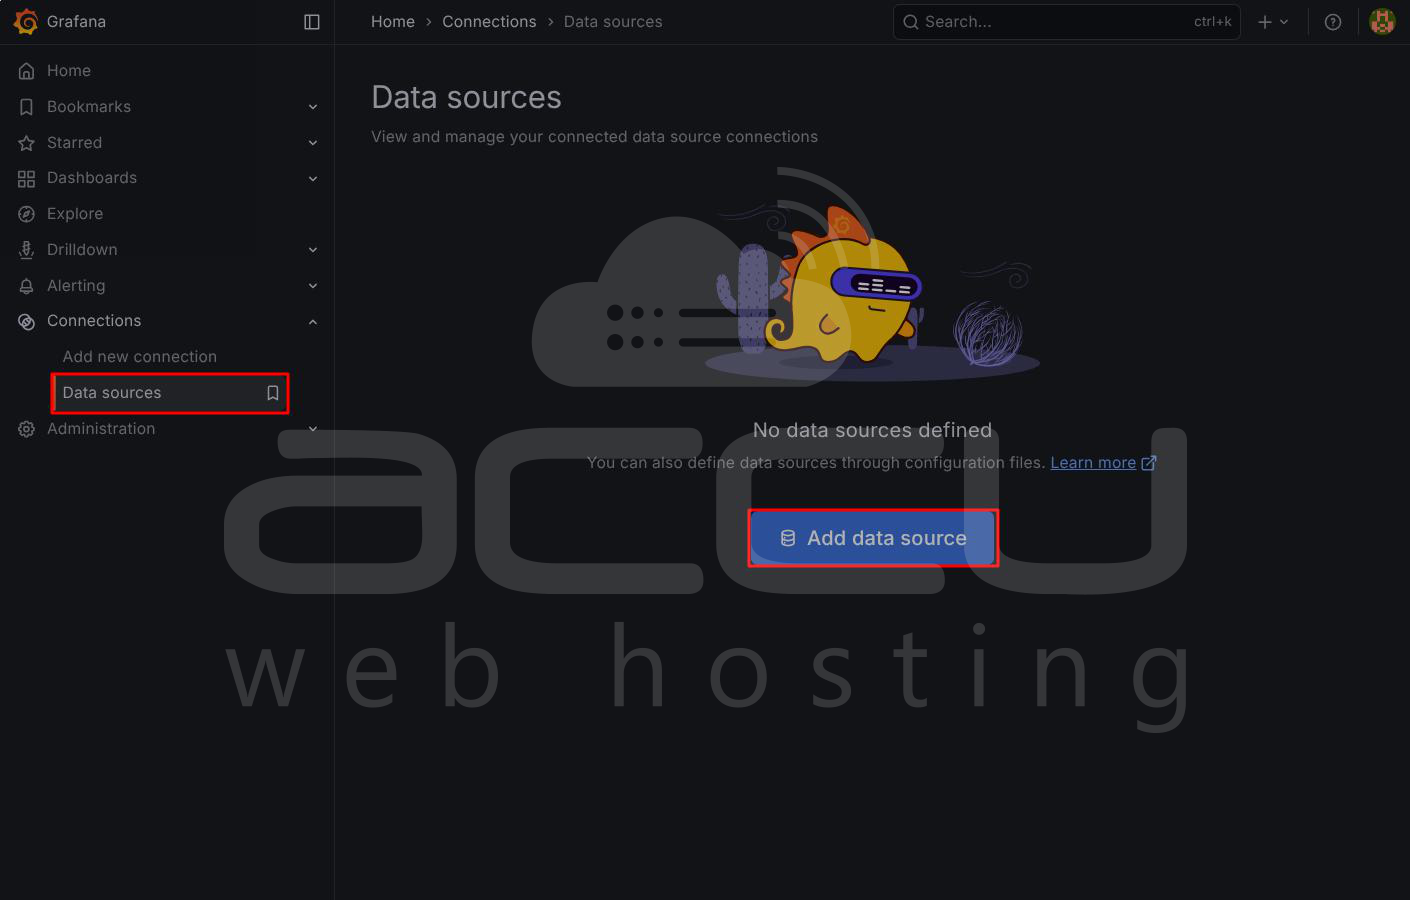
Step 4: Connect Grafana to Prometheus. To visualize metrics, Grafana must be connected to Prometheus.
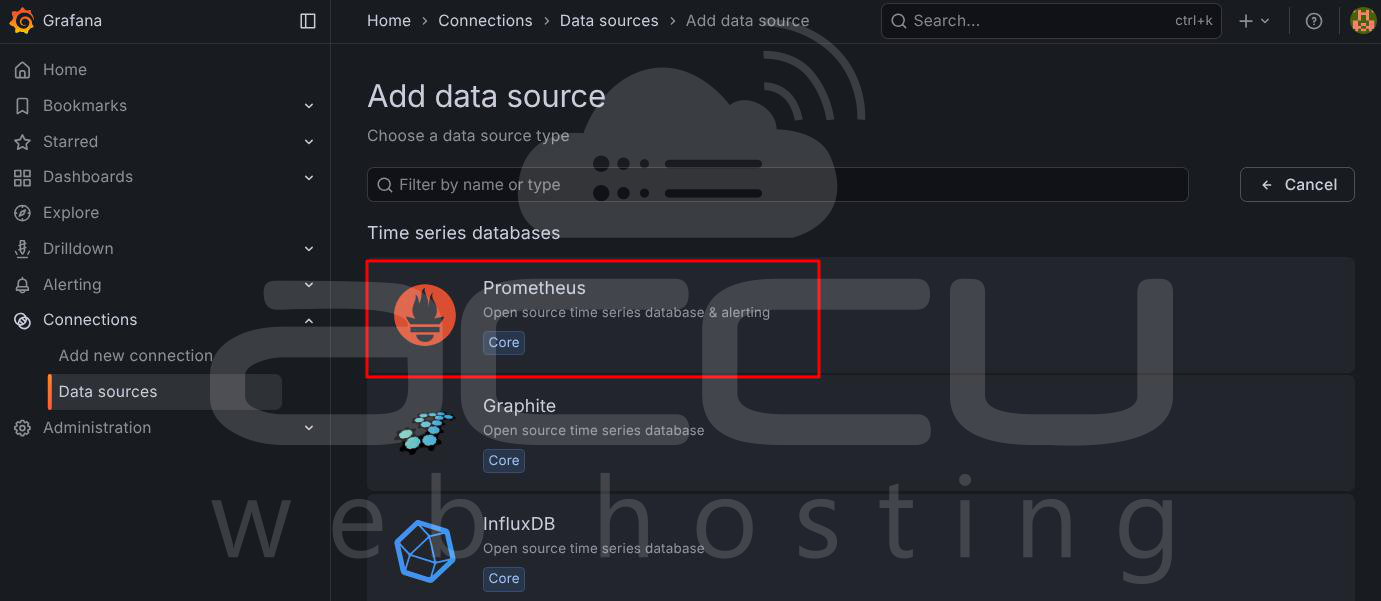
1. Go to Configuration → Data Sources and click Add data source.
2. Select Prometheus.
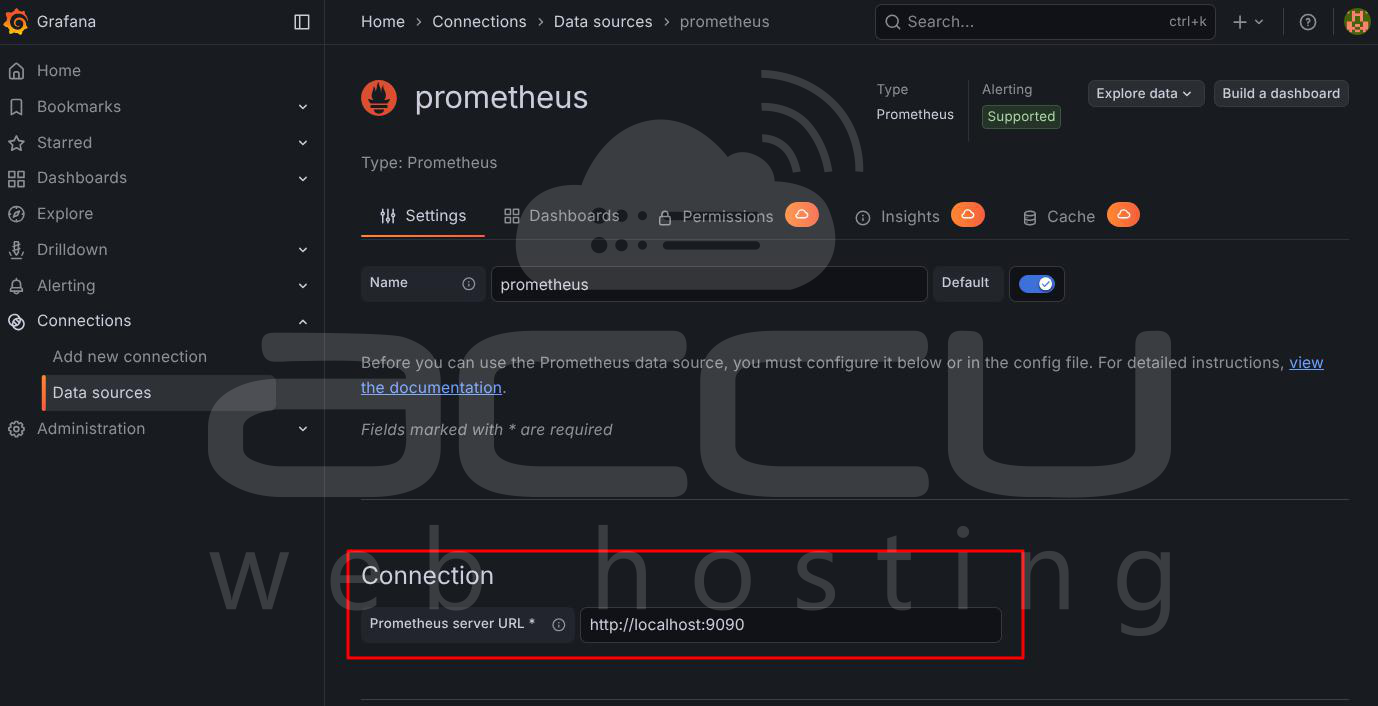
3. Set the URL to: http://localhost:9090
4. Click Save & Test
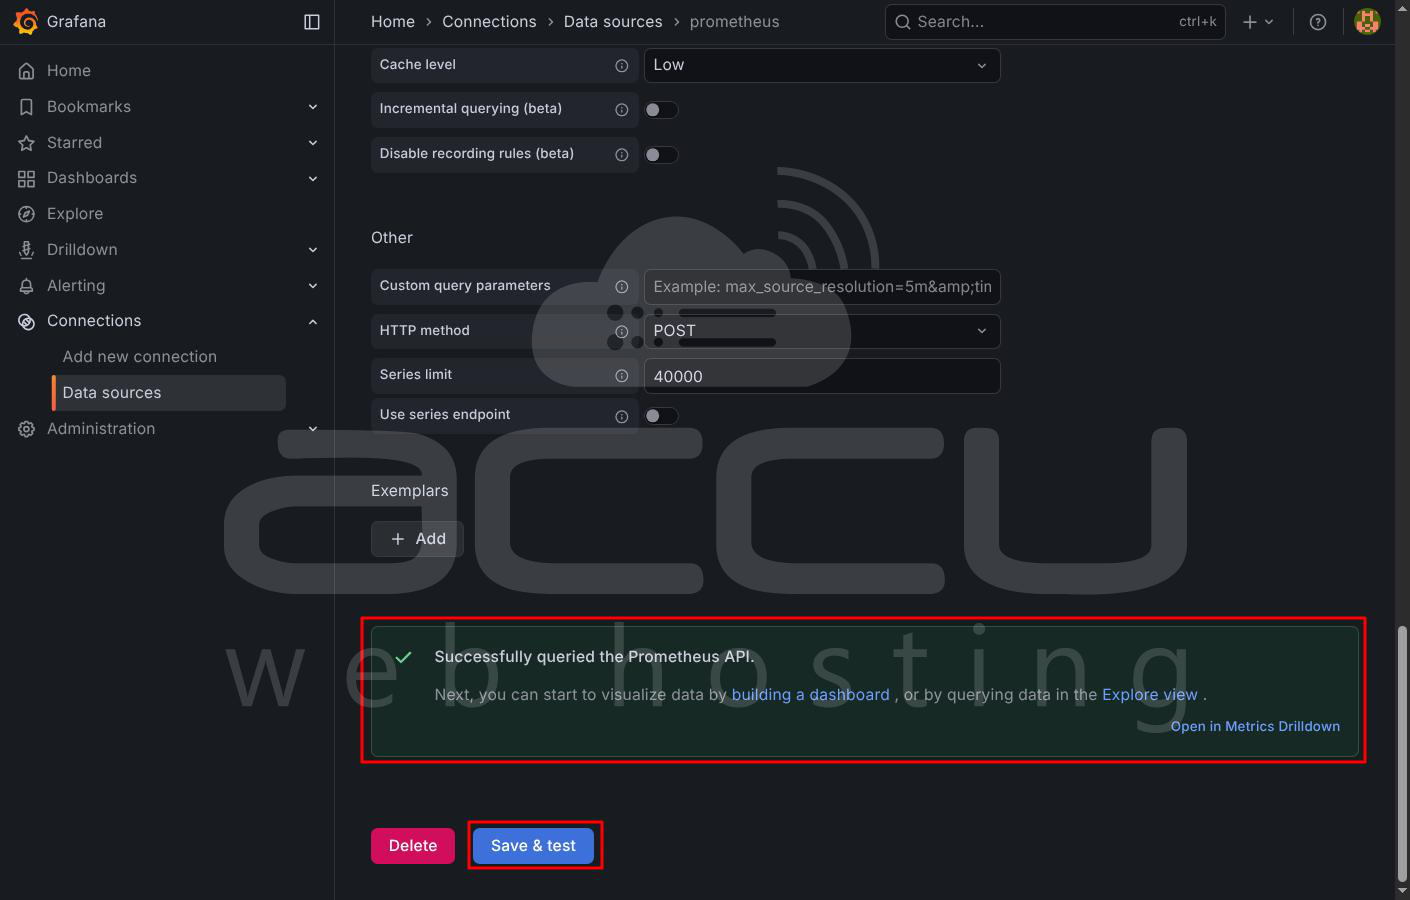
A success message confirms that Grafana can communicate with Prometheus.
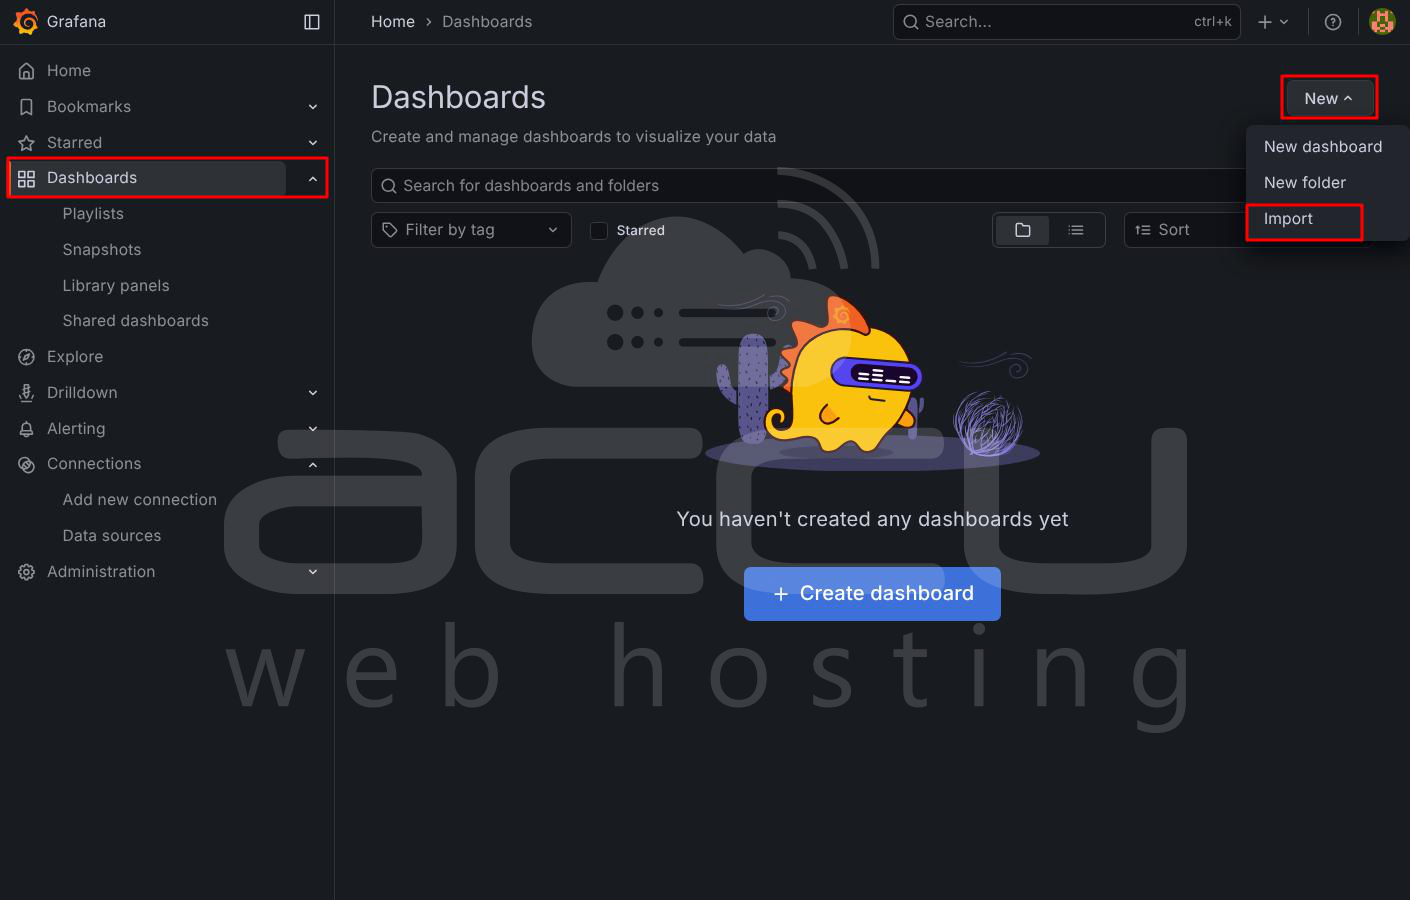
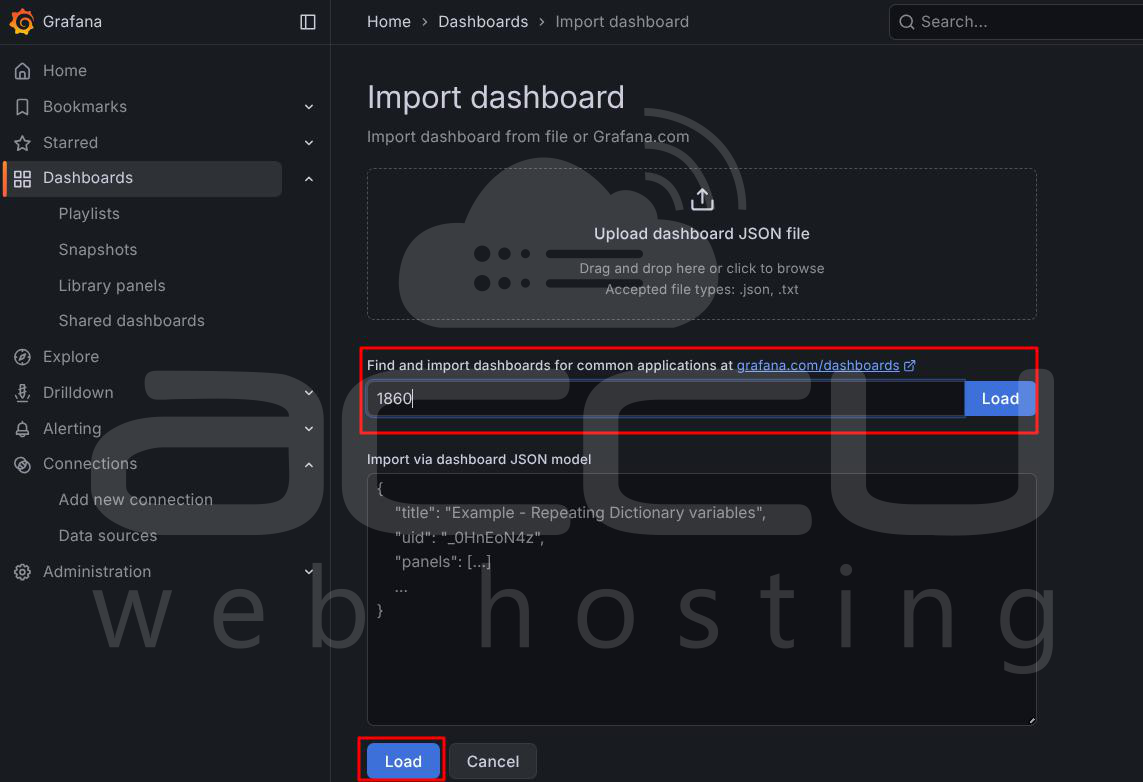
Step 5: Import a Pre-Built Dashboard. Instead of creating dashboards from scratch, you can import a ready-made one.
1. Go to Dashboards → Import
2. Enter dashboard ID 1860 (Node Exporter Full)
3. Click Load
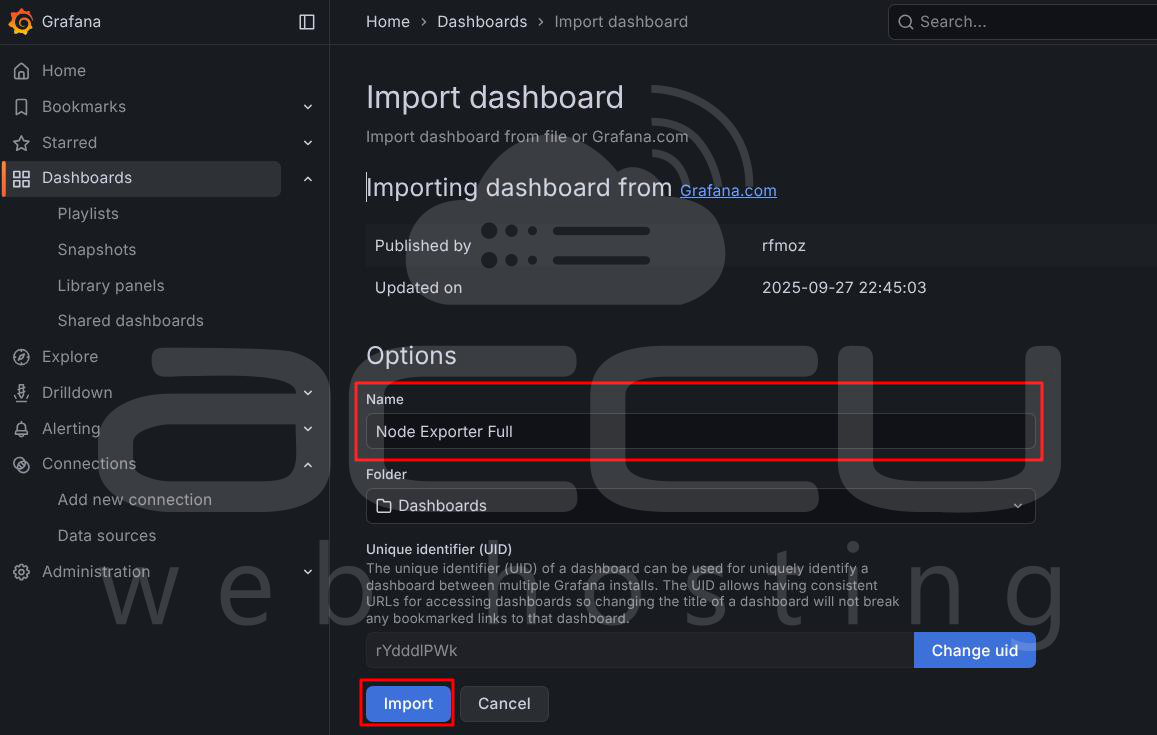
4. Select your Prometheus data source.
5. Click Import
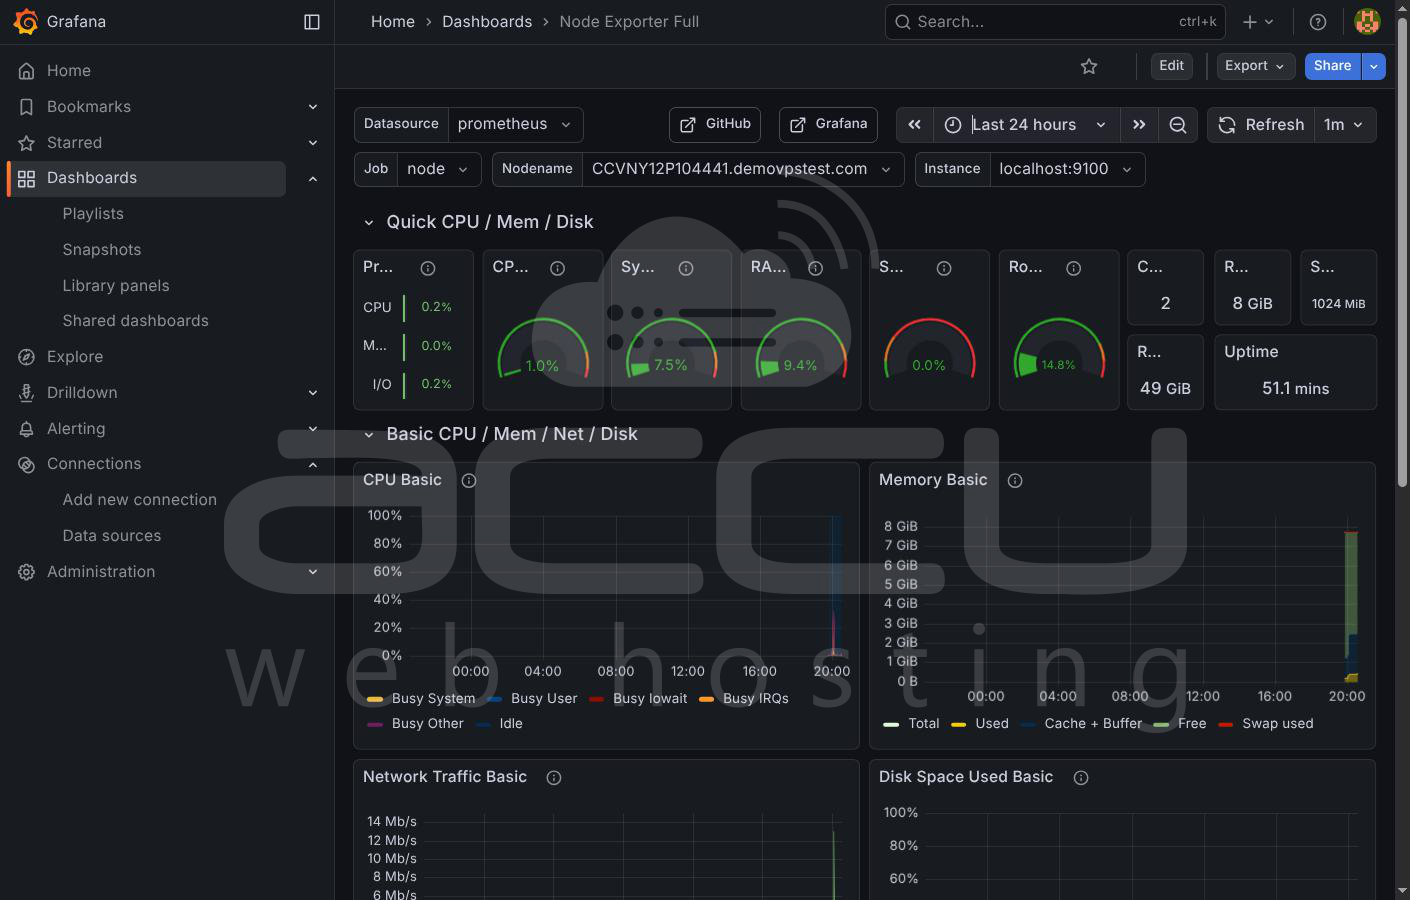
This dashboard provides detailed system insights, including:
- CPU usage per core
- Memory utilization
- Disk I/O and storage usage
- Network traffic statistics
- System load averages
Conclusion
Setting up server monitoring with Prometheus and Grafana provides a strong foundation for maintaining system reliability and performance. Prometheus continuously collects detailed metrics from your server, while Grafana transforms that data into clear and actionable visual dashboards. Together, they allow administrators to detect performance bottlenecks, analyze historical trends, and respond to issues before they impact applications.
By using Node Exporter and a pre-built Grafana dashboard, you can achieve full system visibility with minimal configuration effort. As your infrastructure grows, this monitoring setup can be extended with alerts, additional exporters, and custom dashboards to match your operational needs. With Prometheus and Grafana in place, your server monitoring becomes proactive instead of reactive, helping ensure long-term stability and efficient resource usage.
