
A slow-loading website can be a sign of website overload, which can impact performance and user experience. When your hosting resources exceed their limits, your site may become sluggish or even temporarily unavailable. Fortunately, cPanel provides tools to monitor and manage resource usage effectively. In this guide, we’ll walk you through checking and troubleshooting website overload issues using cPanel.
Access Resource Usage
Step 1: Log in to your cPanel account provided by your web hosting provider.
Step 2: Go to the Metrics section and click on Resource Usage.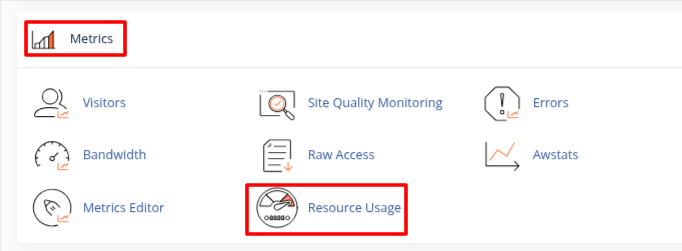
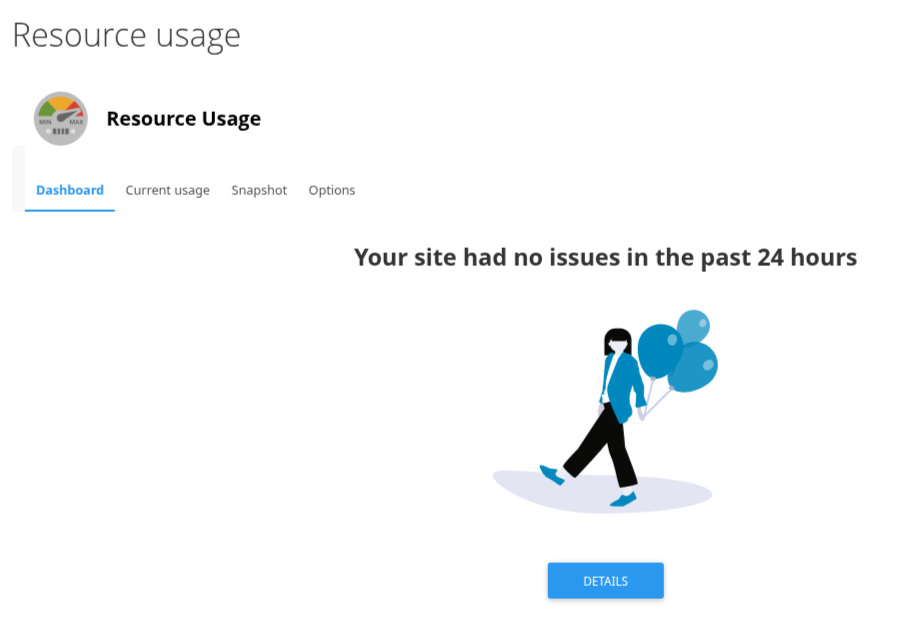
Step 3: After clicking on Resource Usage, you will see one of these messages.
- No issues in the past 24 hours – Your website is running without problems.
- Limited within the past 24 hours – Your site has exceeded resource limits, causing overload. You can check which resources were overused.
- Might hit resource limits soon – Your site is close to exceeding limits, which may lead to overload. cPanel will show which resources are affected.
Check Resource Usage Details
Step 1: Click the Details button or go to the Current Usage tab to see the cause of high resource usage. This section provides information on resource types like memory, CPU, inodes, and input/output. 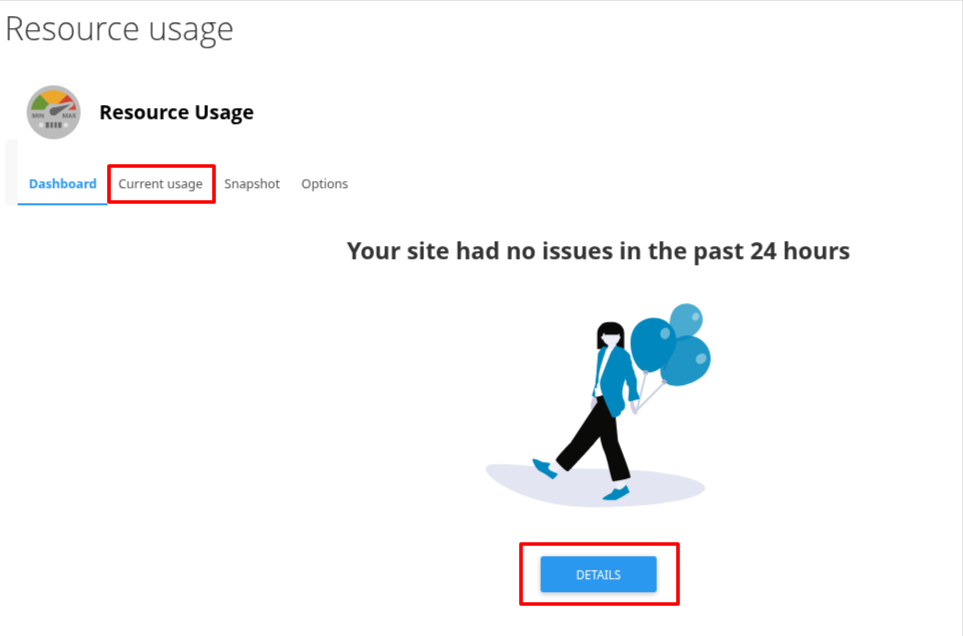
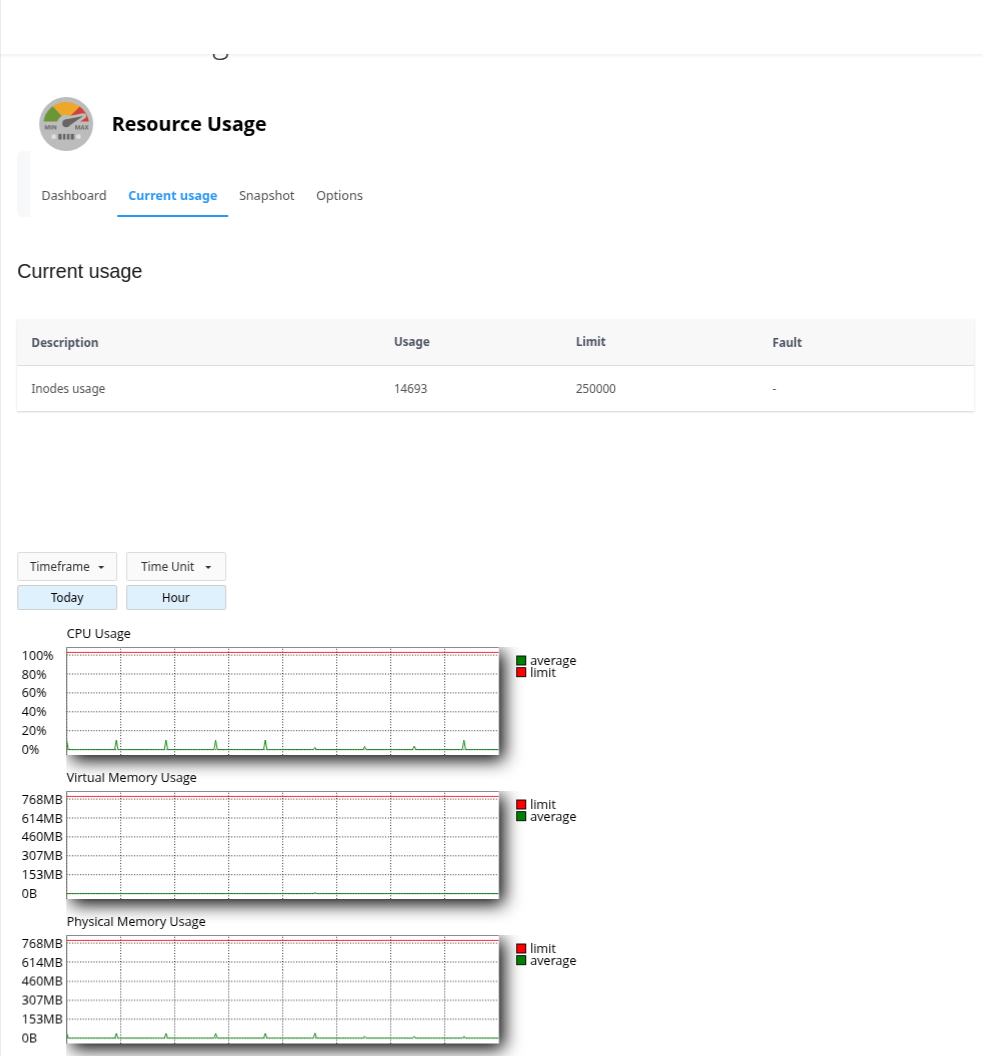
Step 2: By default, the graphs display hourly resource usage for the day. If you wish to change these settings, select a different option using the Timeframe and Time Unit drop-down menus.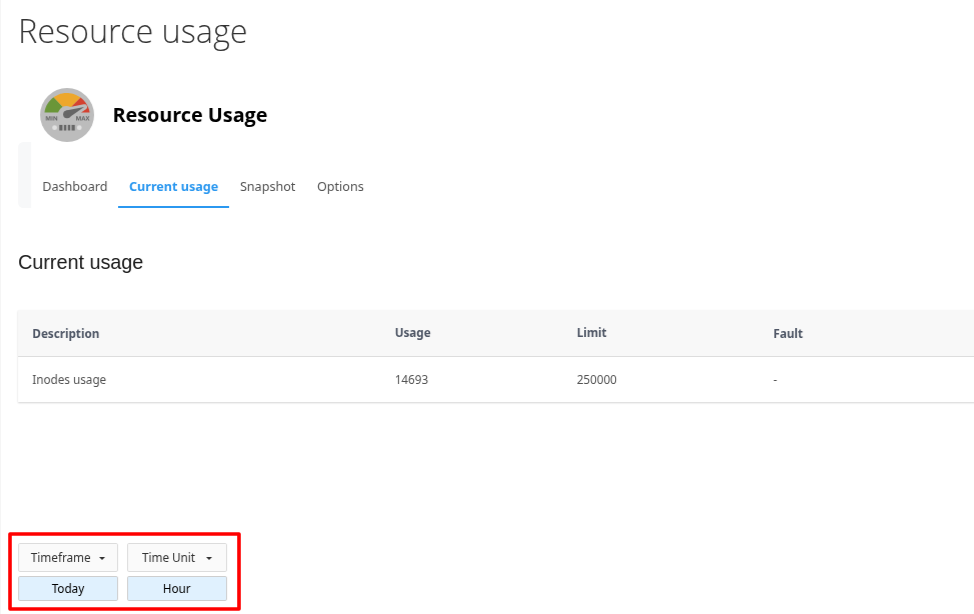
Check the Snapshots
Step 1: Click the Snapshots tab to view detailed records of your website’s activity at specific times. These snapshots display processes that use a lot of resources.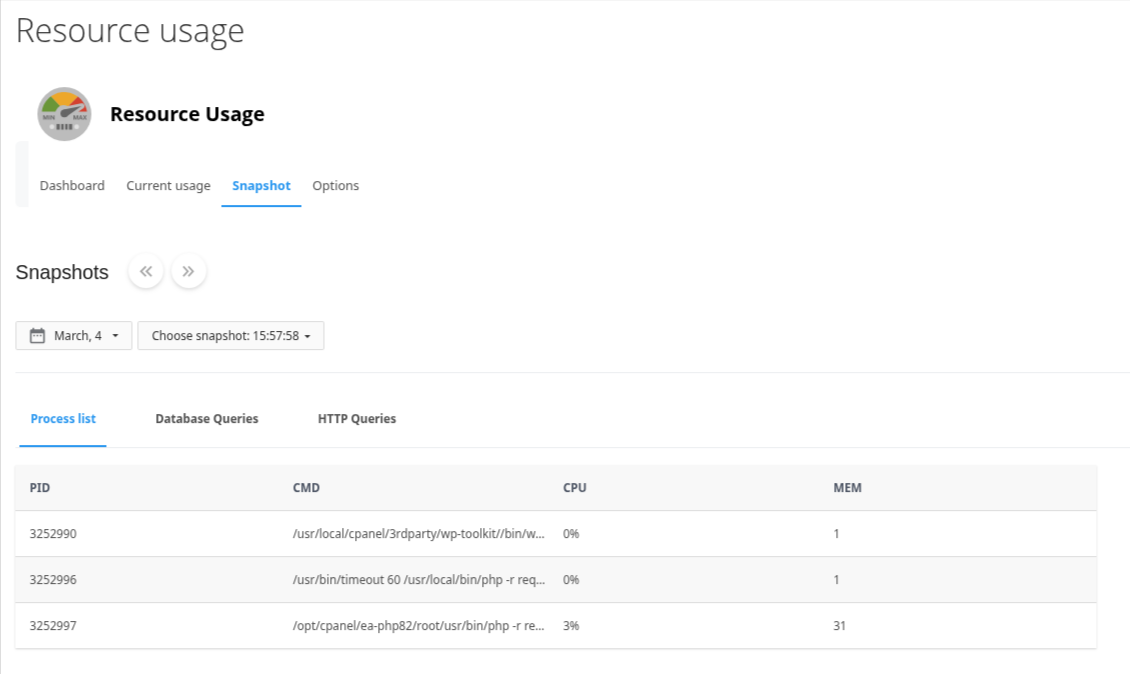
The process list includes four columns:
- PID – Process ID
- CMD – Process name
- CPU – CPU usage percentage
- MEM – Memory consumption
Check Database and HTTP Queries
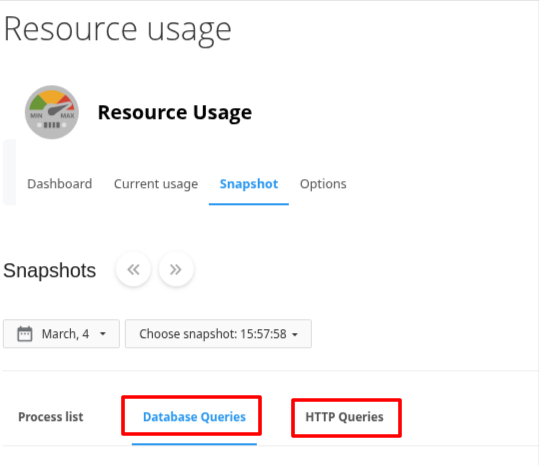
In the Database Queries tab, you’ll see a list of running queries along with their execution time and frequency.
By looking at the Database Queries tab, users can identify which queries are running, how long they take, and how often they execute. This helps in spotting queries that may be slowing down the database.
The HTTP Queries tab displays requests to your website, including file size and response time.
The HTTP Queries tab shows requests made to the website, including the file sizes and response times. This allows users to see if large files or excessive requests consume too many resources.
How to Fix Website Overload Issues?
Server factors can cause website overload issues, including insufficient server resources, unoptimized content, and inefficient code. These issues can result in slow loading times, errors, and even website crashes. Let’s check some common ways to fix the website overload issues.
- Upgrade Hosting Plan: Switch to VPS or dedicated servers for better resource handling.
- Enable Caching: Use caching plugins to serve cached content and reduce server load.
- Compress Images: Reduce image sizes with tools like WP Smush for faster loading.
- Minify Code: Remove unnecessary characters from HTML, CSS, and JavaScript files.
- Limit Plugins: Deactivate and delete unnecessary plugins to avoid resource bloat.
- Optimize Redirects: Eliminate unnecessary redirects to improve response times.
- Use a CDN: Implement a Content Delivery Network to distribute data globally.
- Monitor Bottlenecks: Use analytics tools to identify high-traffic pages and resource hogs.
- Secure Against DDoS Attacks: Implement firewalls and DDoS protection services.
- Optimize Media Files: Convert images to WebP format and use lazy loading.
- Regular Maintenance: Keep your CMS, themes, and plugins updated for efficiency.