When a Windows VPS becomes extremely slow while the virtualization node remains healthy, troubleshooting becomes challenging because the issue is isolated to the guest OS. Other VMs may run normally, hypervisor metrics may look stable, yet the affected VPS experiences lag, unresponsiveness, or timeouts. This guide explores ten comprehensive solutions you should implement when diagnosing and resolving slow performance on a Windows VPS where the host node is confirmed healthy. Each solution is grounded in real-world experience and addresses a different layer of the performance stack, from CPU and memory to disk I/O, network, and application behavior.
Understanding the Baseline Problem
A Windows VPS may run slow even if the host server is healthy because it works in layers: physical hardware → hypervisor (like KVM, VMware, Hyper-V, ESXi) → guest Windows OS.
Slow performance usually comes from inside the VPS, such as high CPU/RAM usage, wrong VM settings, disk or network bottlenecks, background Windows tasks, driver issues, or malware. Since the host is fine, hardware failure is not the cause. We will now go through 10 quick fixes in priority order.
Solution 1: Analyze Real-Time Resource Usage with Task Manager and Resource Monitor
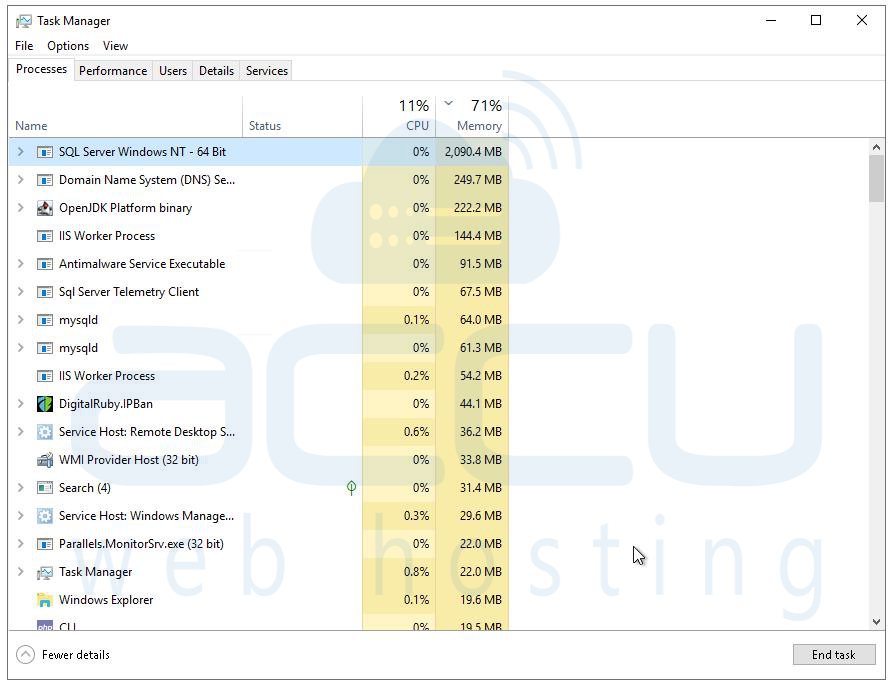
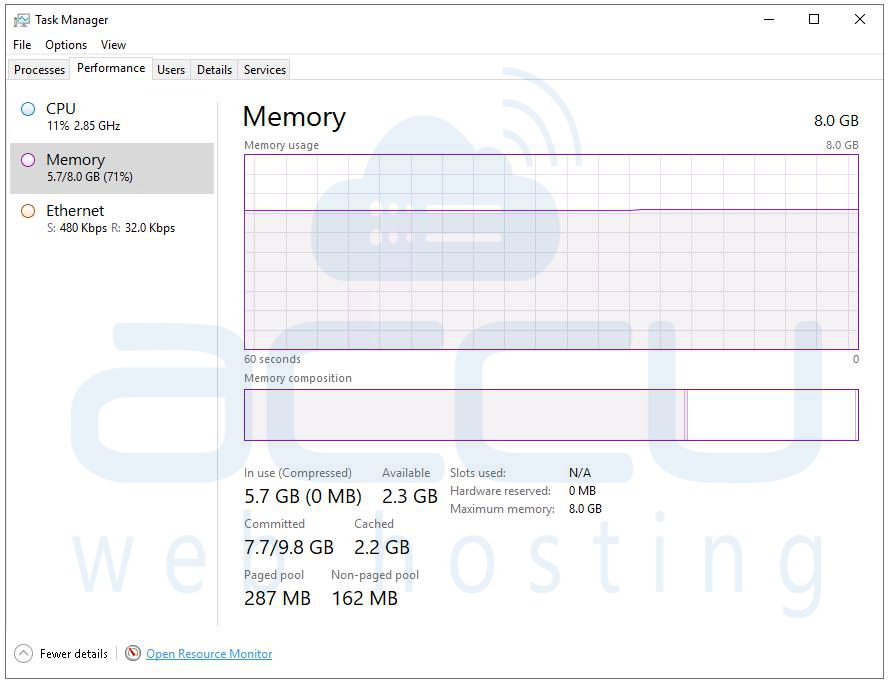
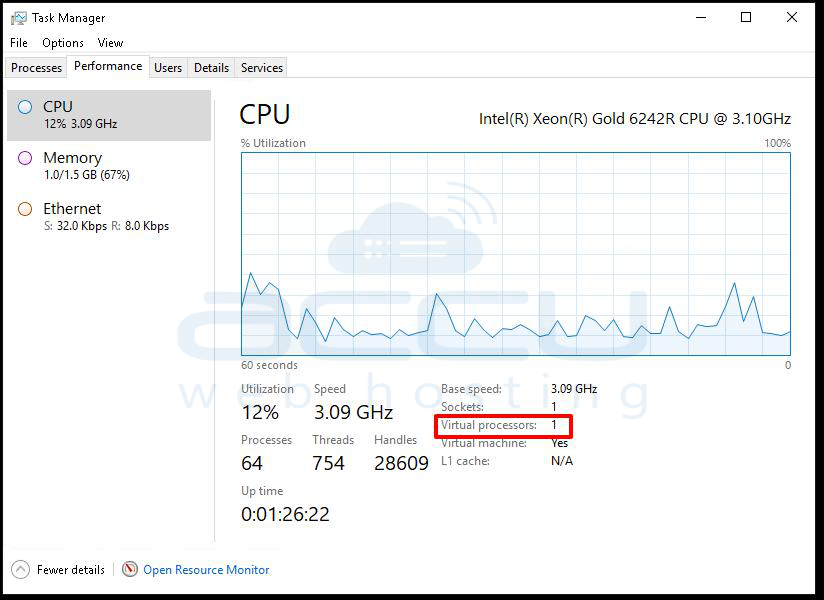
The very first step when a Windows VPS is sluggish is to get eyes on what's actually consuming resources right now. Open Task Manager (Ctrl + Shift + Esc) and navigate to the Performance tab. This gives you a live dashboard of CPU utilization, memory consumption, disk activity, and network throughput. If you see CPU sitting at 90–100%, that immediately tells you something is either working hard legitimately or running amok.
Switch to the Processes tab and sort by CPU or Memory to identify the top consumers. Common culprits include Windows Update (TiWorker.exe, WUDFHost.exe), antivirus scanning (MsMpEng.exe for Windows Defender), Search Indexing (SearchIndexer.exe), SYSTEM processes stuck in loops, or rogue third-party applications. Once you identify the offending process, you can make a judgment call, kill it temporarily, delay it, or investigate further.
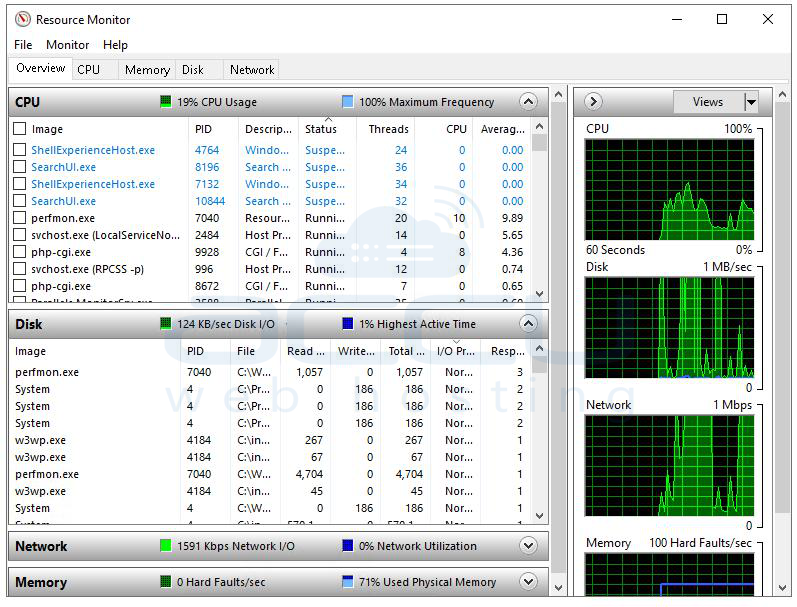
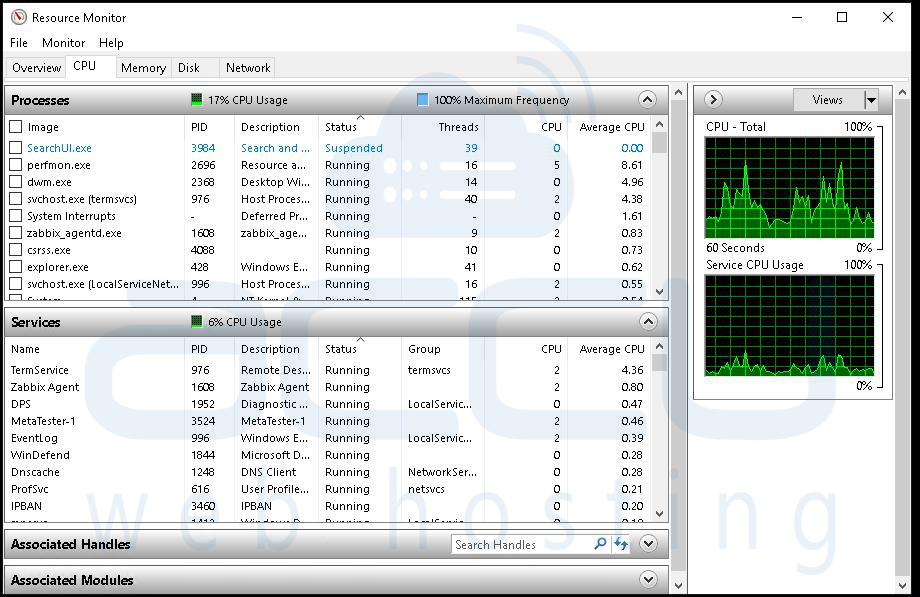
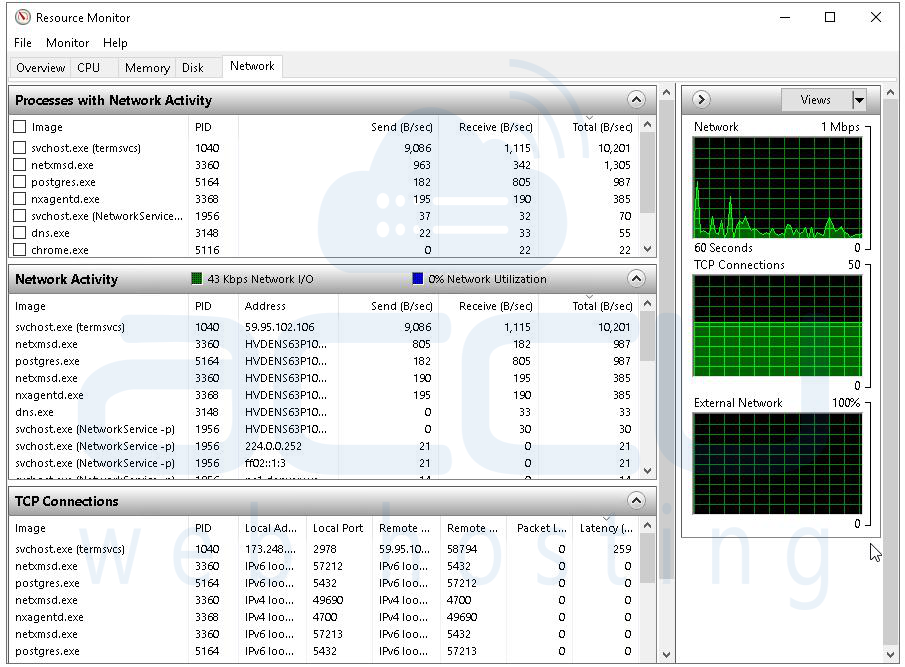
For deeper analysis, open Resource Monitor (type resmon in the Run dialog). Resource Monitor is far more granular than Task Manager. Under the CPU tab, you can see which processes are generating the most interrupts and context switches, high interrupt rates often point to driver issues or hardware emulation problems in the virtual environment. Under the Disk tab, you can see which files are being read or written the most, and critically, what the disk queue length looks like.
A consistently high disk queue (above 2) means your storage subsystem is overwhelmed. Under the Network tab, you can monitor per-process network activity to catch anything making excessive outbound connections.
This first step costs you nothing and often reveals the answer within five minutes. Don't skip it in favor of more complex diagnostics, the simplest explanation is frequently the right one.
Solution 2: Investigate Memory Pressure, Paging, and Virtual Memory Configuration
Memory is one of the most common causes of Windows VPS sluggishness, and it manifests in a deceptive way. The system may not appear to be out of RAM, but if Windows is heavily using the page file (swapping memory contents to disk), performance degrades dramatically, especially since the "disk" in a virtual environment may itself have latency characteristics very different from physical RAM.
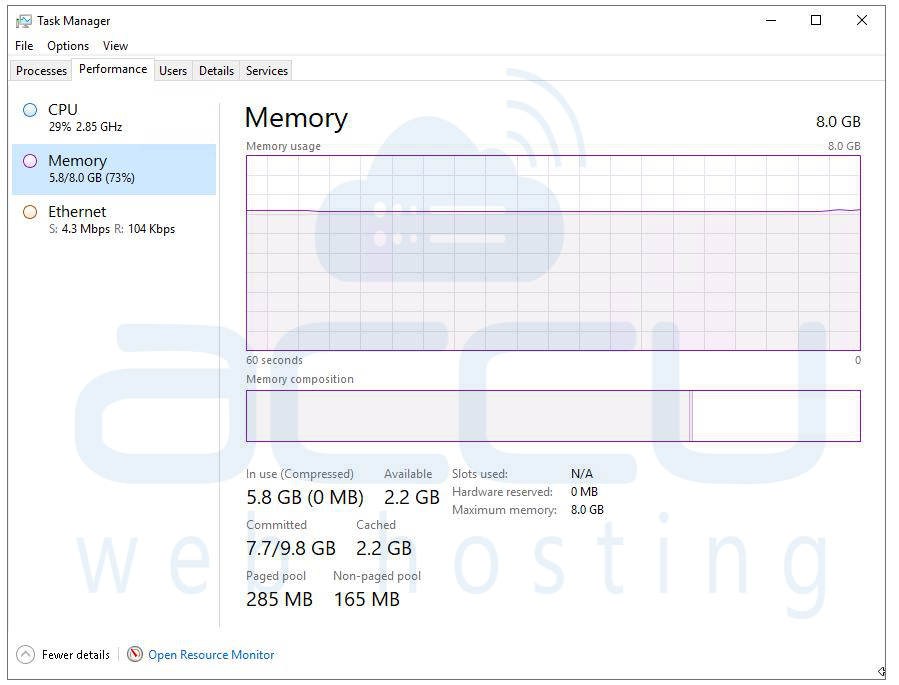
Start by checking available memory in Task Manager. If your VPS has 8 GB of RAM allocated and you're consistently seeing less than 15–20% free, you're in dangerous territory. Windows needs breathing room to cache frequently accessed files and data in memory. When that room disappears, the OS starts moving memory pages to the page file on disk, and every time those pages are needed again, the disk must be read, a process hundreds of times slower than accessing RAM.
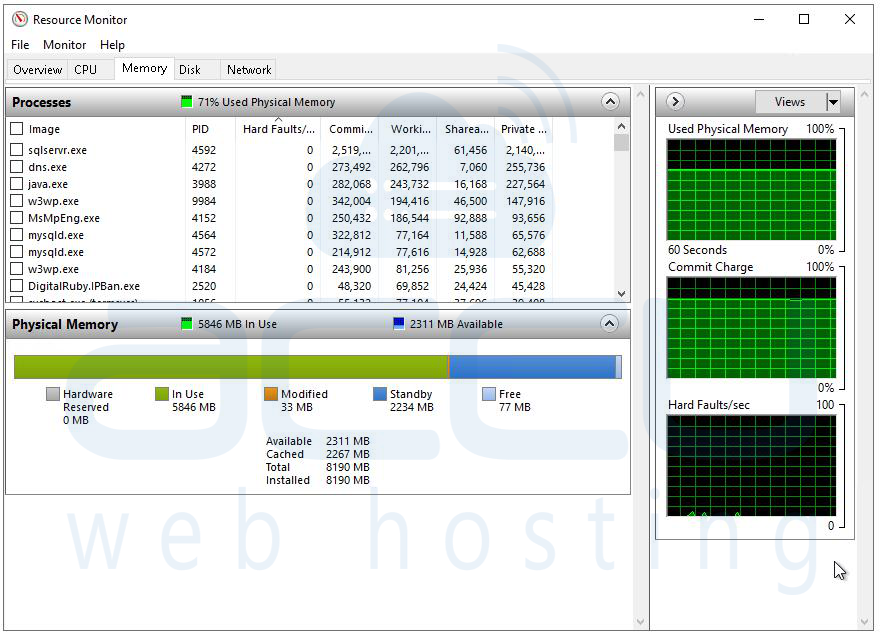
Open Resource Monitor and go to the Memory tab. Look at the "Hard Faults/sec" counter. A hard fault occurs when Windows looks for a memory page and finds it has been paged out to disk rather than sitting in RAM. Even a few hundred hard faults per second will cause visible sluggishness. If you're seeing thousands of hard faults per second, you have a serious memory pressure problem.
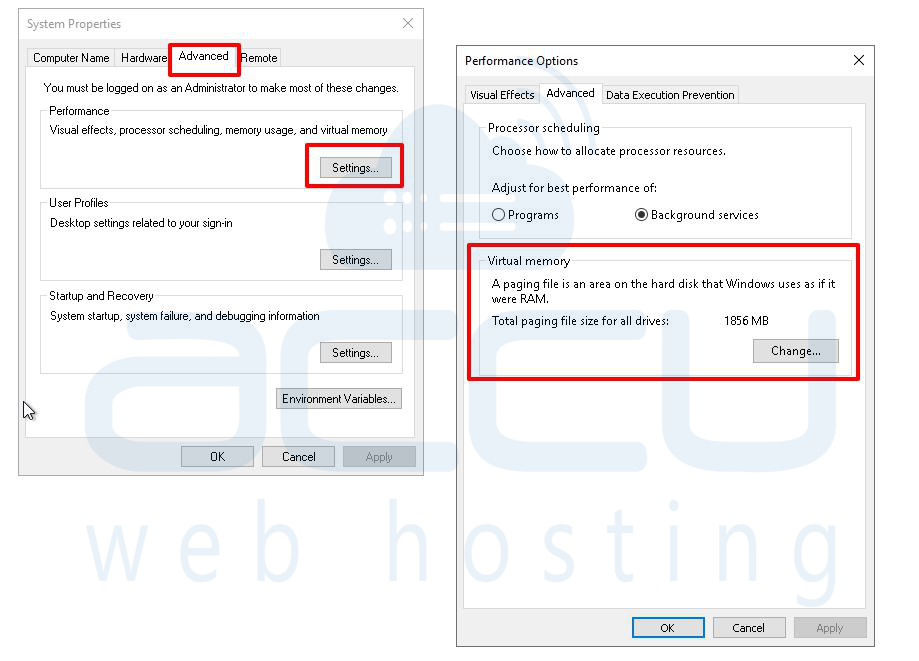
Check your virtual memory (page file) configuration. Go to System Properties > Advanced > Performance Settings > Advanced > Virtual Memory. Windows generally manages this automatically, but in some VPS environments, particularly those with limited or fast storage, manual configuration of the page file can help. Consider placing the page file on the fastest available virtual disk. If possible, the better long-term solution is to request more RAM allocation for the VM.
Also audit installed software for memory leaks. Some applications, particularly web servers (IIS), Java-based applications, or poorly written third-party tools, will slowly consume RAM over hours or days without releasing it. Compare memory usage after a fresh reboot versus after 24 or 48 hours of uptime. If RAM consumption grows steadily without a corresponding increase in user activity, a memory leak is almost certainly present.
Solution 3: Examine Disk I/O Performance and Virtual Disk Health
Disk performance in a Windows VPS is one of the trickiest areas to diagnose because it involves multiple layers: the virtual disk format, the storage backend on the hypervisor, and how the guest OS communicates with its virtual disk controller.
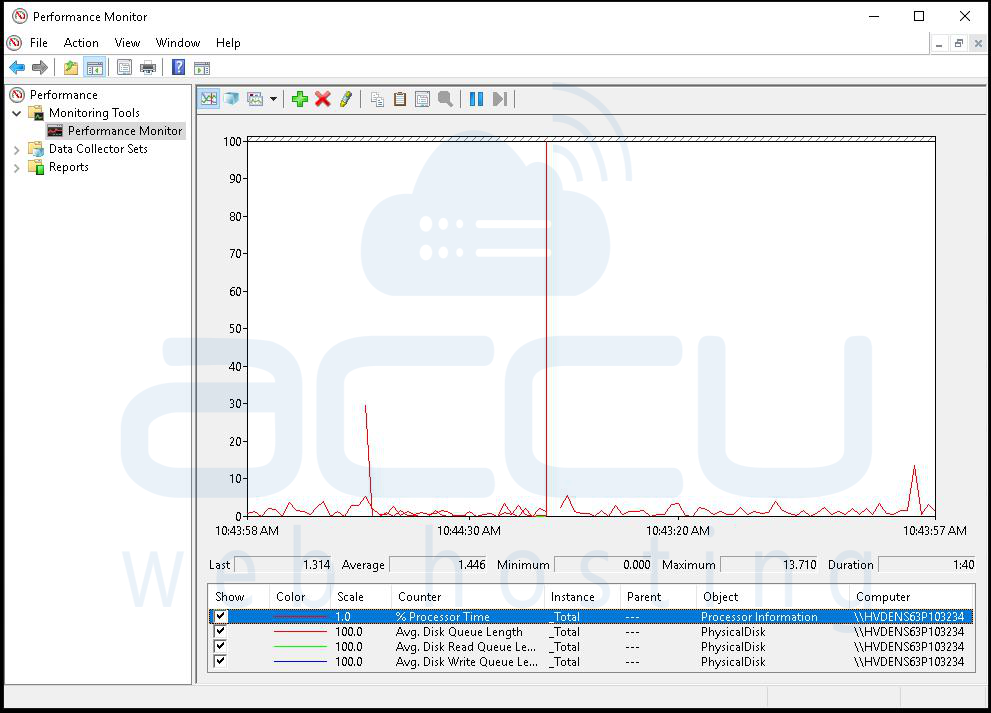
Start with Performance Monitor (perfmon). Add the following counters under PhysicalDisk: Avg. Disk Queue Length, Avg. Disk Sec/Read, and Avg. Disk Sec/Write.
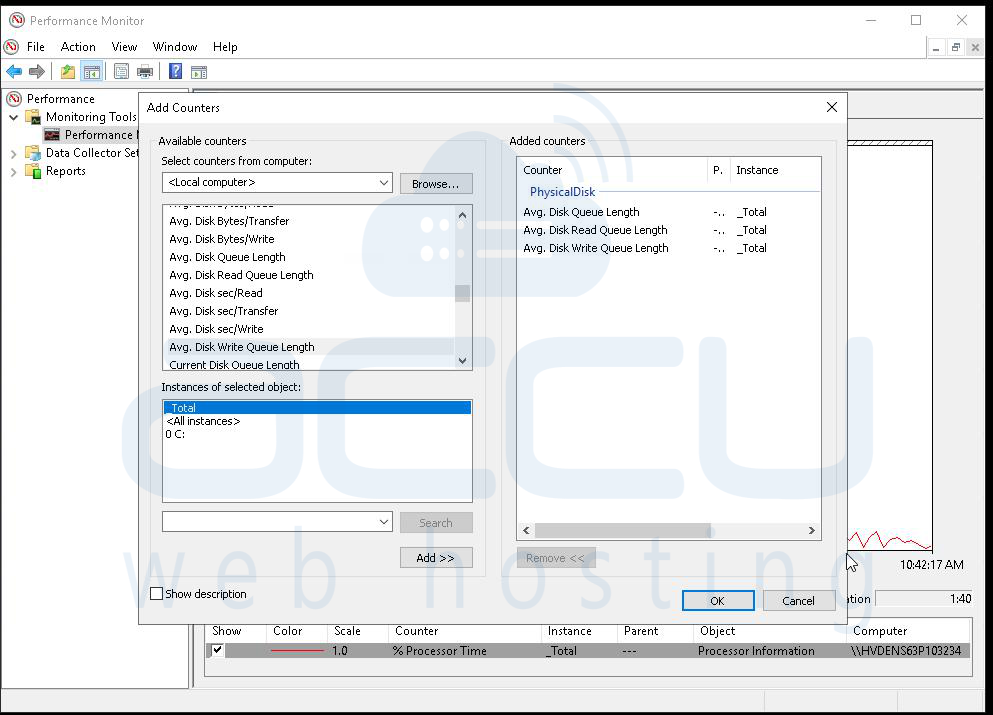
As a rough guideline, read latency above 20ms and write latency above 10ms for sequential operations suggests the storage subsystem is under stress. A disk queue length consistently above 2 is a red flag.
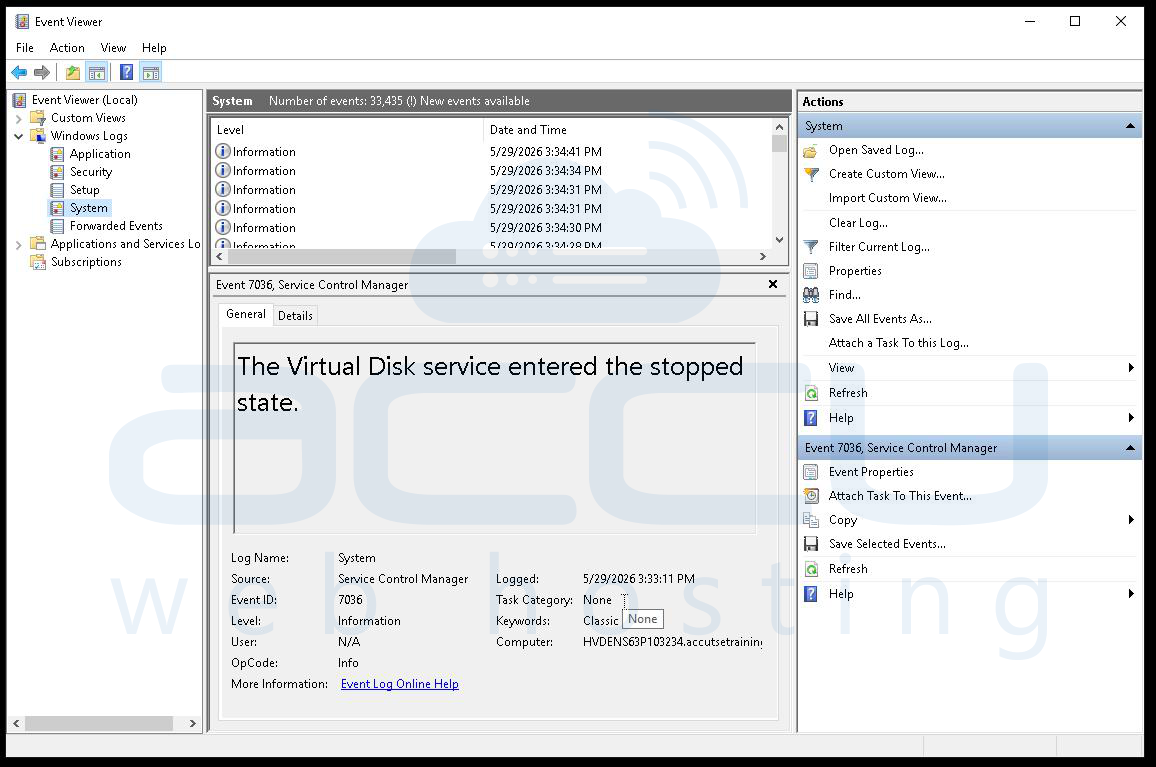
From an elevated command prompt, run the SMART diagnostics if your virtual disk supports passthrough. For most VPS environments, you'll instead want to look at the Windows Event Viewer (eventvwr.msc) for disk-related errors. Navigate to Windows Logs > System and filter for events from sources like "disk" or "Ntfs." Frequent disk errors, delayed write failures, or file system errors can indicate corruption or a struggling storage backend.
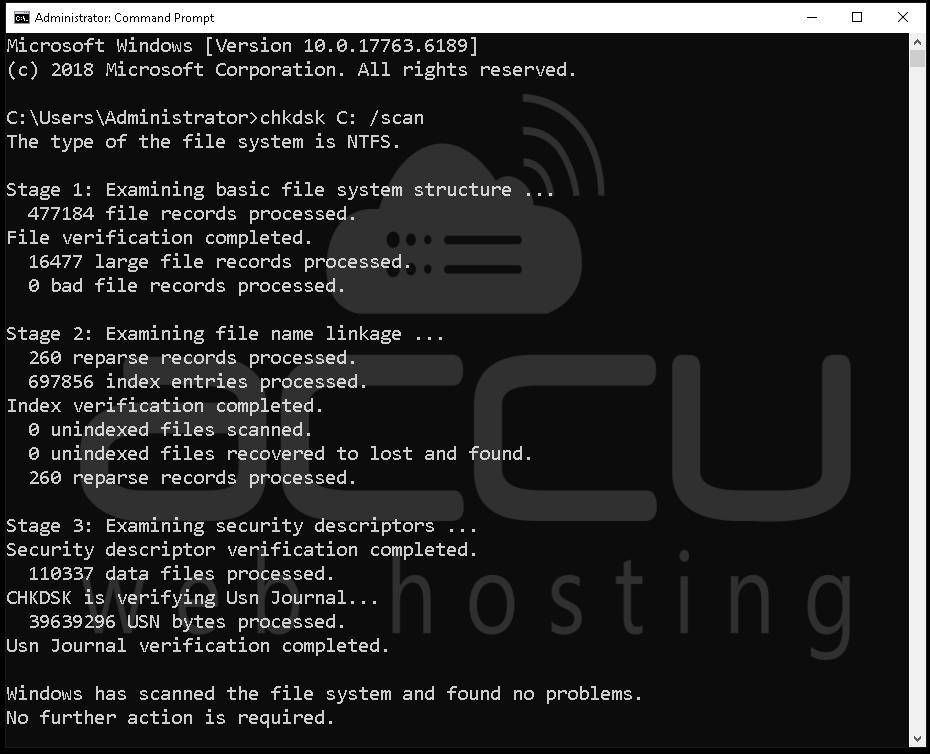
Run chkdsk to check for file system errors. From an elevated command prompt, execute: chkdsk C: /scan. This performs an online scan without requiring a reboot. If errors are found, schedule a full repair with chkdsk C: /f /r at the next restart. File system corruption, even minor, can cause I/O requests to take significantly longer than normal as Windows attempts to work around bad sectors or corrupted metadata.
Also evaluate your disk's fragmentation status. While SSDs and NVMe drives don't suffer from physical fragmentation, the file system metadata can still benefit from optimization. Run the built-in Optimize Drives tool (dfrgui) to check the optimization status of each volume. For VPS environments running on SSD-backed storage (which most modern ones do), Windows should be running TRIM operations, not traditional defragmentation.
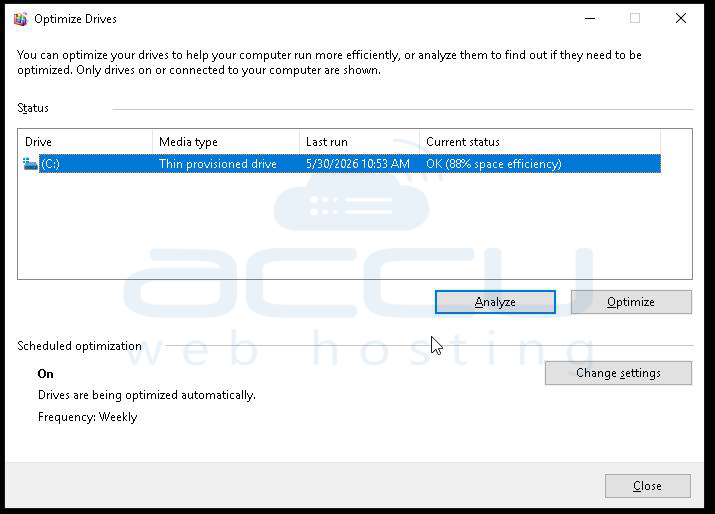
If you have access to the hypervisor console, check whether the virtual disk is thin-provisioned and running out of physical space on the datastore. A thin-provisioned virtual disk that's nearly full can cause severe I/O slowdowns as the hypervisor struggles to allocate new blocks.
Solution 4: Review CPU Configuration, Affinity, and NUMA Topology
Even if overall CPU utilization on the node looks fine, your Windows VPS may be suffering from suboptimal CPU configuration at the virtual machine level. This is particularly relevant in environments using NUMA (Non-Uniform Memory Access) architecture. Start by checking how many virtual CPUs (vCPUs) are allocated to the VM and how they map to the physical cores on the host. In some hypervisor configurations, virtual CPUs can be spread across physical NUMA nodes, which means memory access from one vCPU has to cross an interconnect to reach memory associated with a different physical CPU socket, a process with significant latency penalties. This is called NUMA sprawl, and it's a real performance killer that's entirely invisible from within the Windows guest.
Within Windows itself, check the CPU scheduling configuration. Open Task Manager and go to the Performance tab, then click "Open Resource Monitor." Under the CPU tab, look for processes that are generating extremely high numbers of context switches. High context switches can indicate lock contention in multithreaded applications, poorly optimized software, or driver issues.
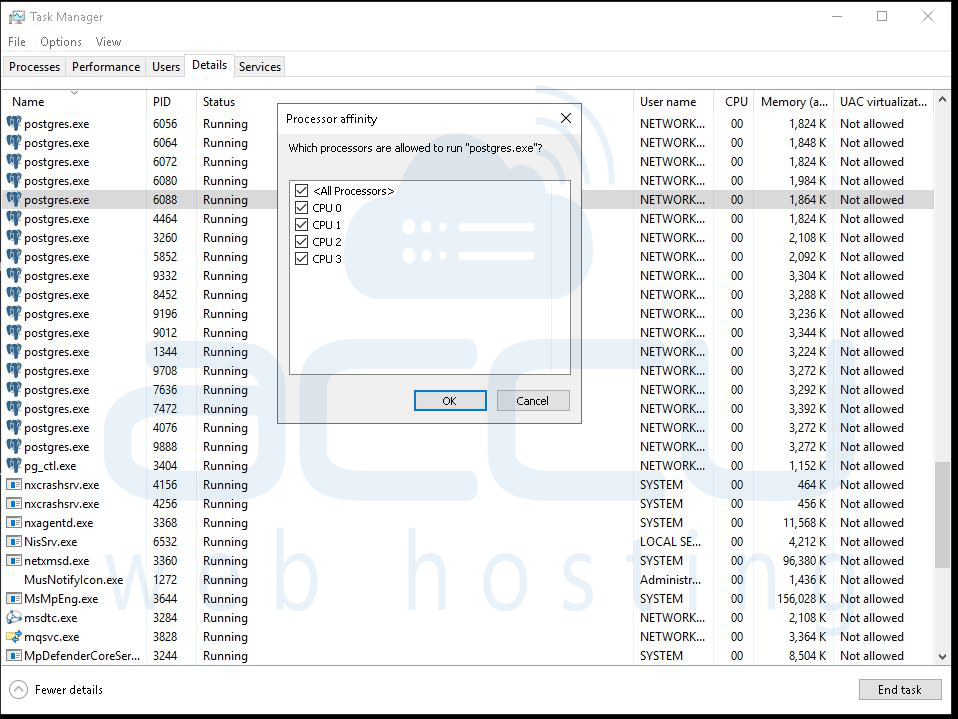
For high-performance workloads, consider setting processor affinity for specific applications to reduce scheduler overhead. Right-click any process in Task Manager and select "Set Affinity" to pin it to specific virtual CPUs. This is particularly useful for database servers or rendering applications that work best when their cache isn't constantly being invalidated by CPU migrations.
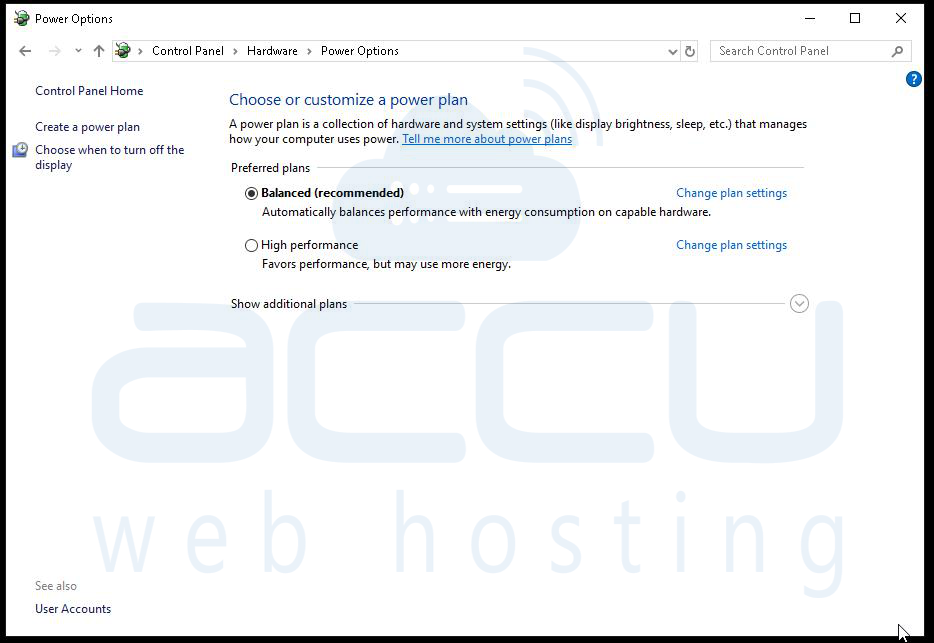
Also verify the power plan setting inside Windows. This sounds trivial, but it's a common oversight in VPS environments. Go to Control Panel > Power Options and ensure the system is set to "High Performance" or "Balanced" rather than "Power Saver." The Power Saver plan throttles CPU frequencies and can cause severe sluggishness in compute-intensive workloads. Many VPS images are deployed with default settings that aren't optimized for server workloads.
Solution 5: Audit Windows Services and Startup Programs
A fresh Windows Server installation comes with dozens of services enabled by default. Many of these are unnecessary in a VPS environment, consume CPU and RAM constantly, and collectively degrade performance more than any single resource hog would alone. Open the Services console (services.msc) and systematically review running services. For a typical Windows Server VPS used as a web server, application server, or database host, many default services are irrelevant. Windows Search (the indexer) is often unnecessary on a server and consumes significant I/O and CPU during indexing cycles.
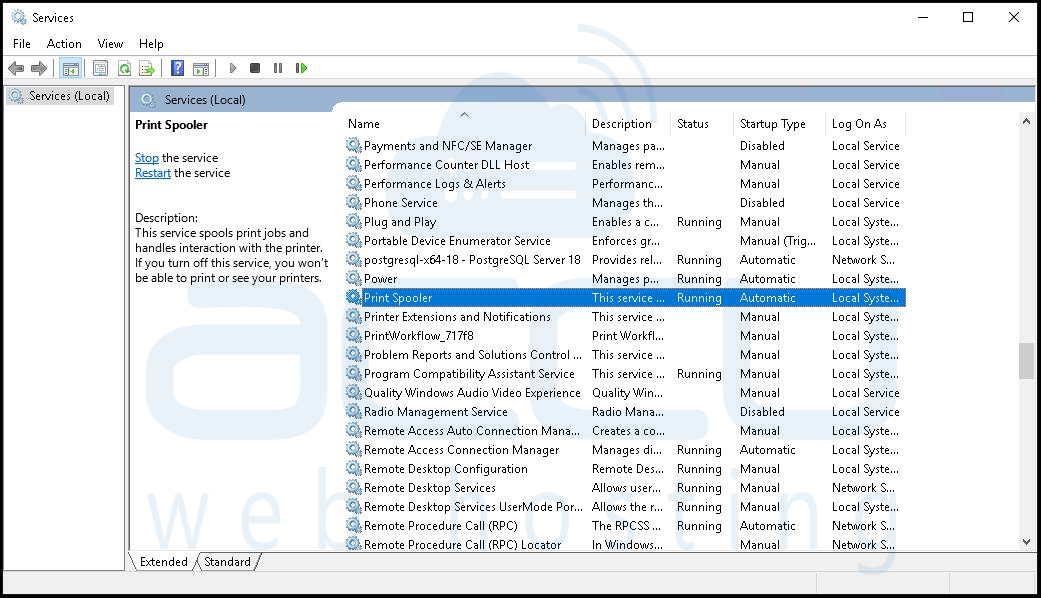
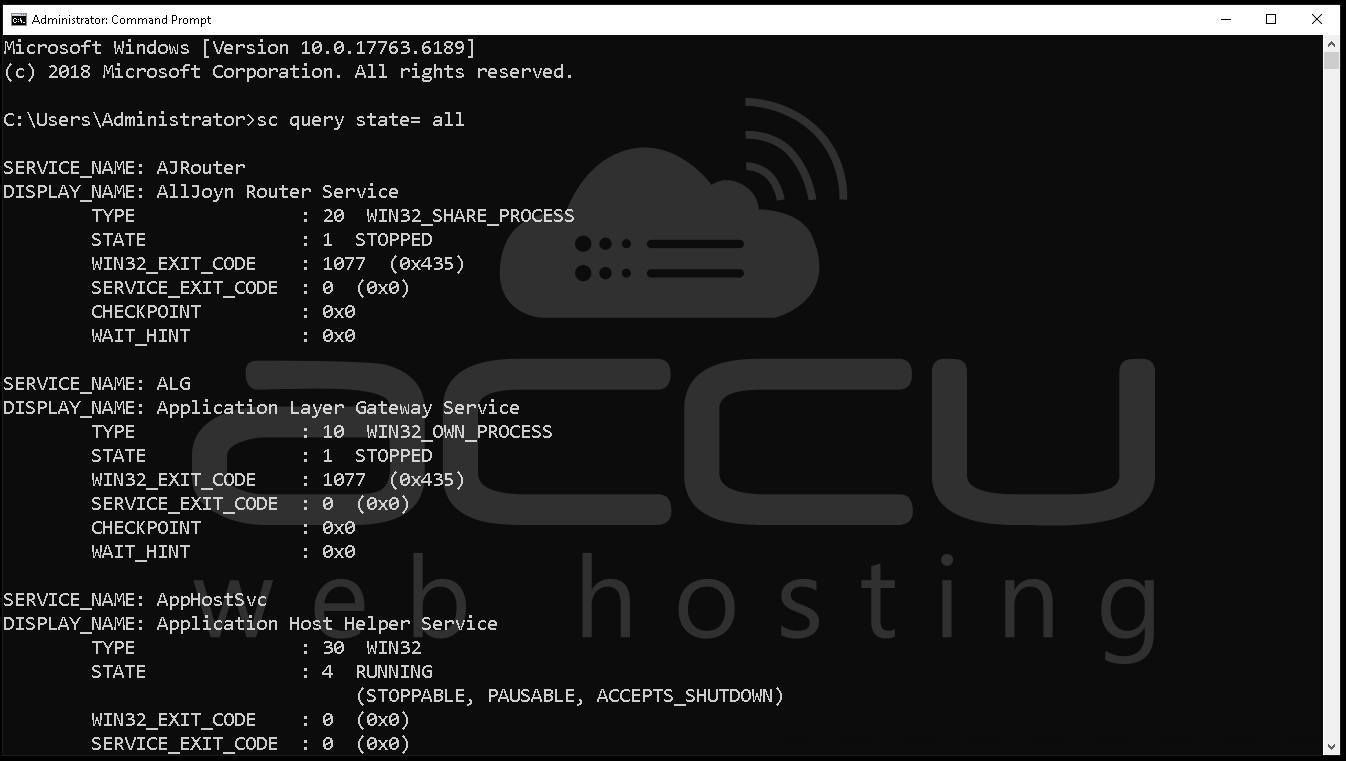
Use the command sc query state= all in an elevated command prompt to list all services, or review them through the Services console. For each running service, ask: Does this VPS need this functionality? If not, set it to "Disabled" or at minimum "Manual" startup.
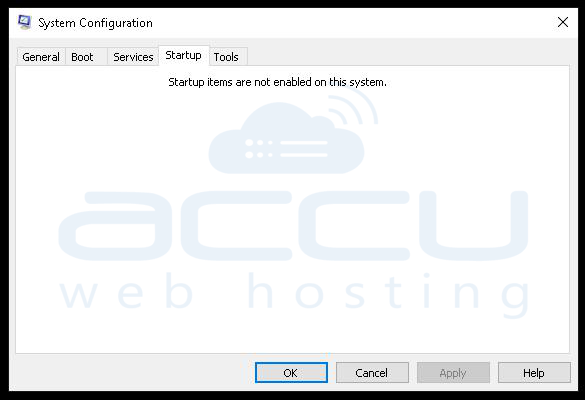
Check startup programs using Task Manager's Startup tab or by running msconfig. Many software packages install startup agents that serve no purpose on a server, update notifiers, analytics daemons, helper utilities, all consuming memory and CPU from the moment the system boots.
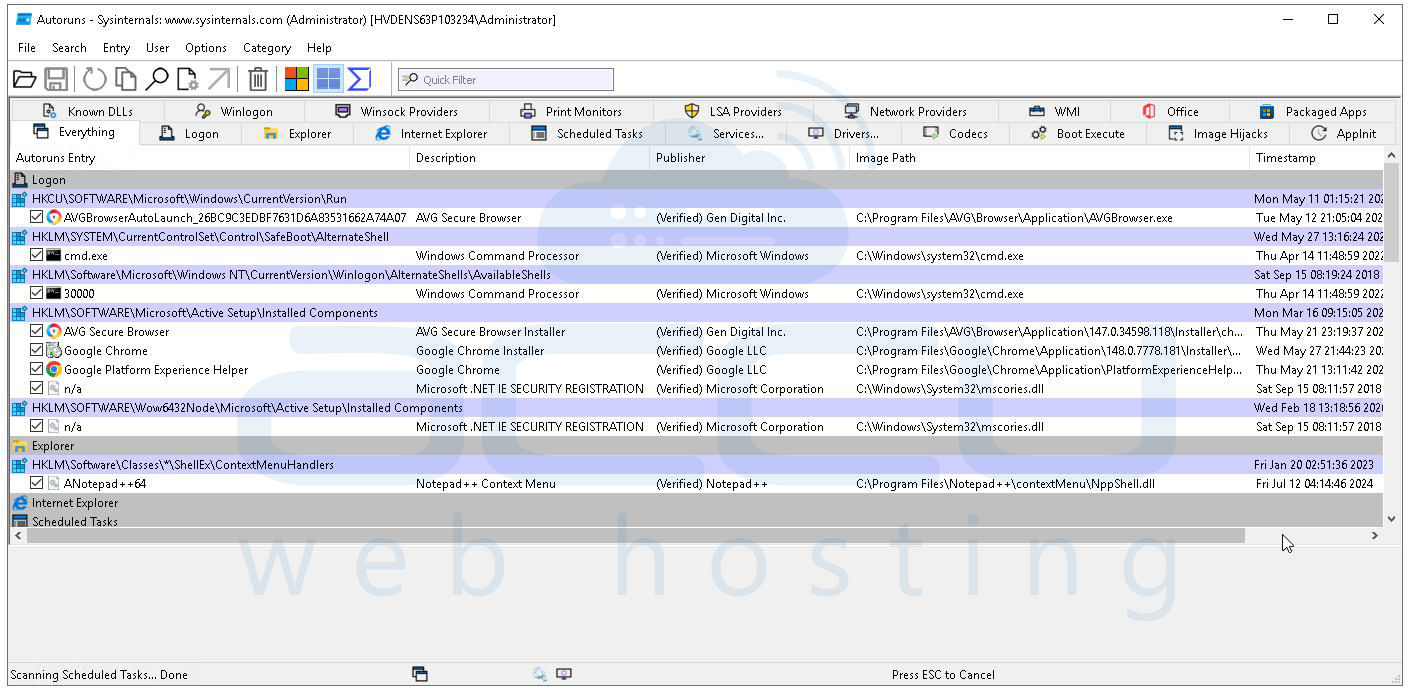
For a more aggressive cleanup approach, use the Sysinternals Autoruns tool (available from Microsoft). Autoruns shows every single thing that launches at startup, login, or system events, far more comprehensive than Task Manager or msconfig. It's one of the most powerful tools available for identifying performance-draining startup items and services on Windows.
Solution 6: Check Network Configuration, Latency, and TCP/IP Stack Health
Network problems can manifest as general system sluggishness, especially if applications on the VPS are waiting on network responses or if the TCP/IP stack itself is misconfigured or under attack.
Start with a basic network performance test from within the VPS. Open PowerShell and run Test-NetConnection -ComputerName <gateway_IP> to check connectivity and latency to your default gateway.
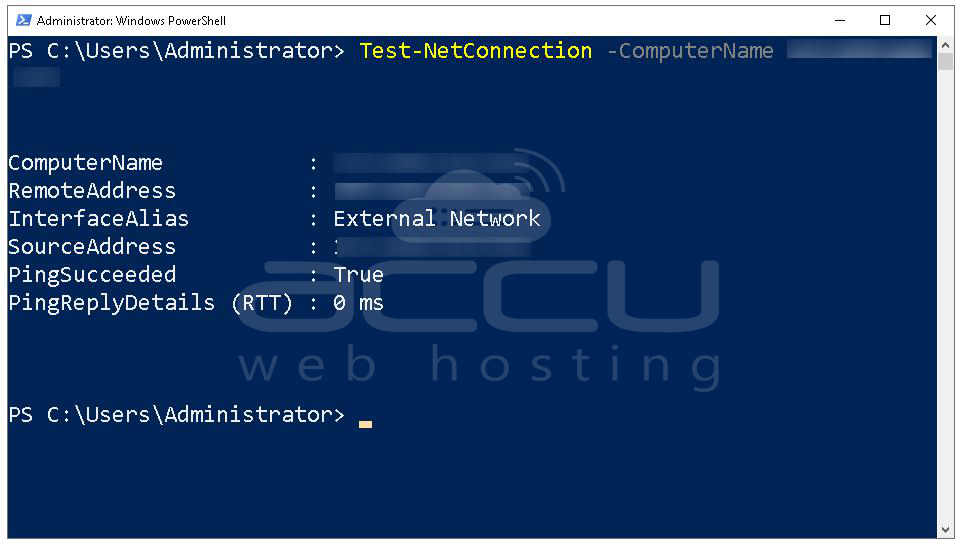
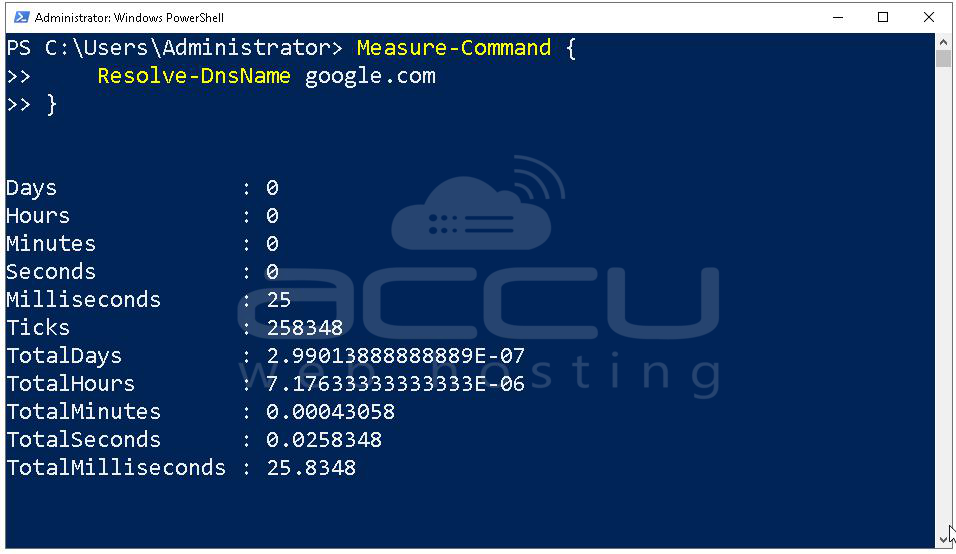
Ping times above 1–2ms to the local gateway (within the same data center) suggest network-level problems. Also test DNS resolution time using Resolve-DnsName google.com and observe how long the query takes. Slow DNS resolution forces every external connection to wait during the lookup phase, which cascades into apparent application sluggishness.
Measure-Command {
Resolve-DnsName google.com
}
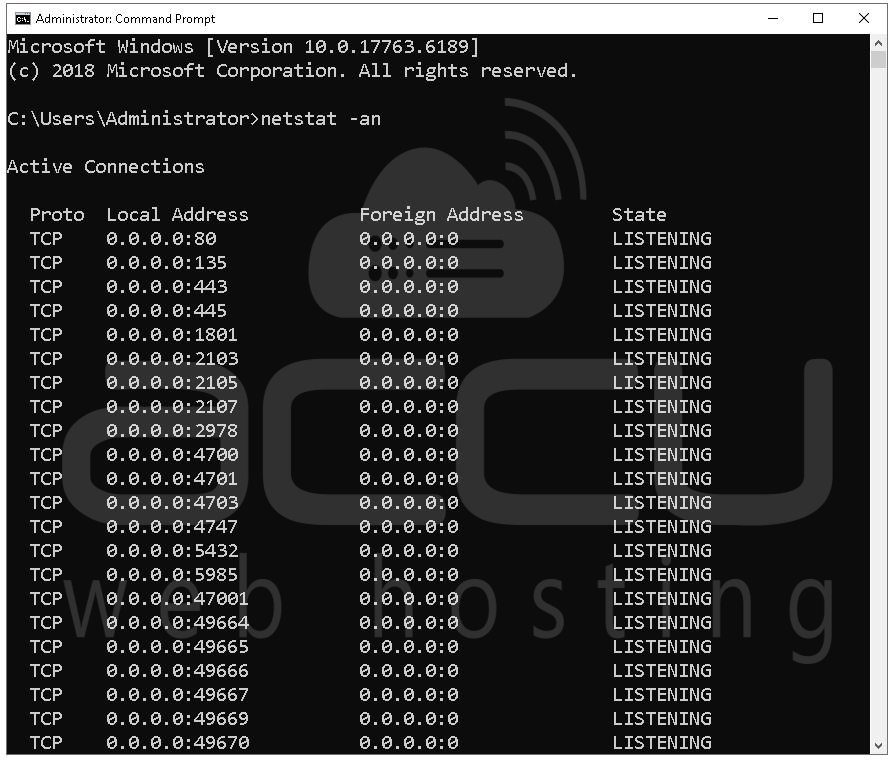
Run netstat -an from an elevated command prompt to view all active connections. Look for large numbers of connections in TIME_WAIT or CLOSE_WAIT states, this can indicate a connection leak in your application layer, or the TCP stack is not releasing connections efficiently. For high-traffic web servers, the default TCP stack settings in Windows may need tuning.
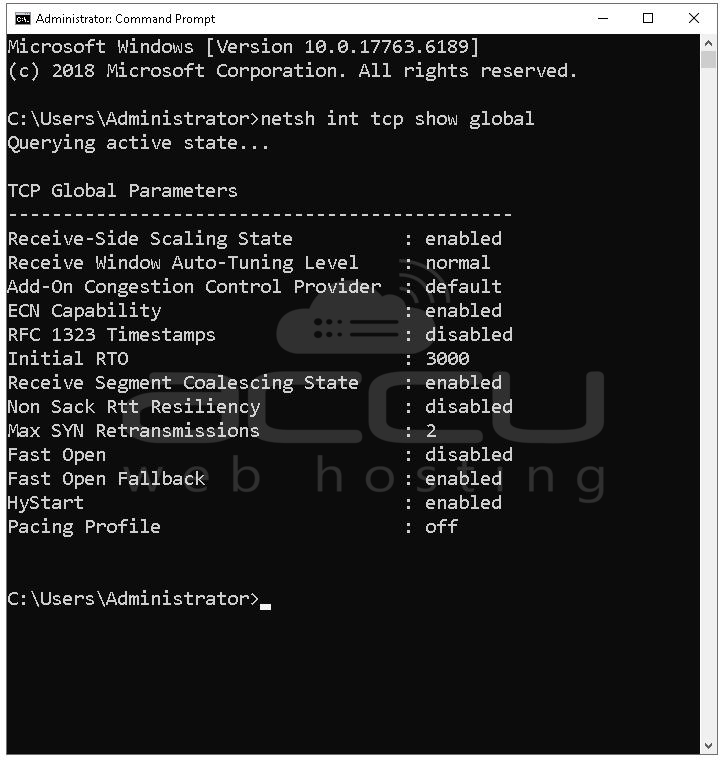
Run netsh int tcp show global to review settings like Receive Window Auto-Tuning and Chimney Offload. In some virtualized environments, disabling TCP chimney offload with netsh int tcp set global chimney=disabled can actually improve stability and performance.
Also check whether any bandwidth-heavy processes are saturating the virtual NIC. Resource Monitor's Network tab shows per-process network activity in real time. A single rogue process doing heavy downloads or a backup job running over the network during production hours can easily saturate a virtual network interface.
Solution 7: Scan for Malware, Cryptominers, and Unauthorized Processes
A Windows VPS that's exposed to the internet is a target. If the system was ever accessible with weak credentials, exposed RDP, or running vulnerable software, it may already be compromised. Cryptomining malware is particularly common on VPS instances because it's designed to run silently, consume CPU and memory, and avoid detection.
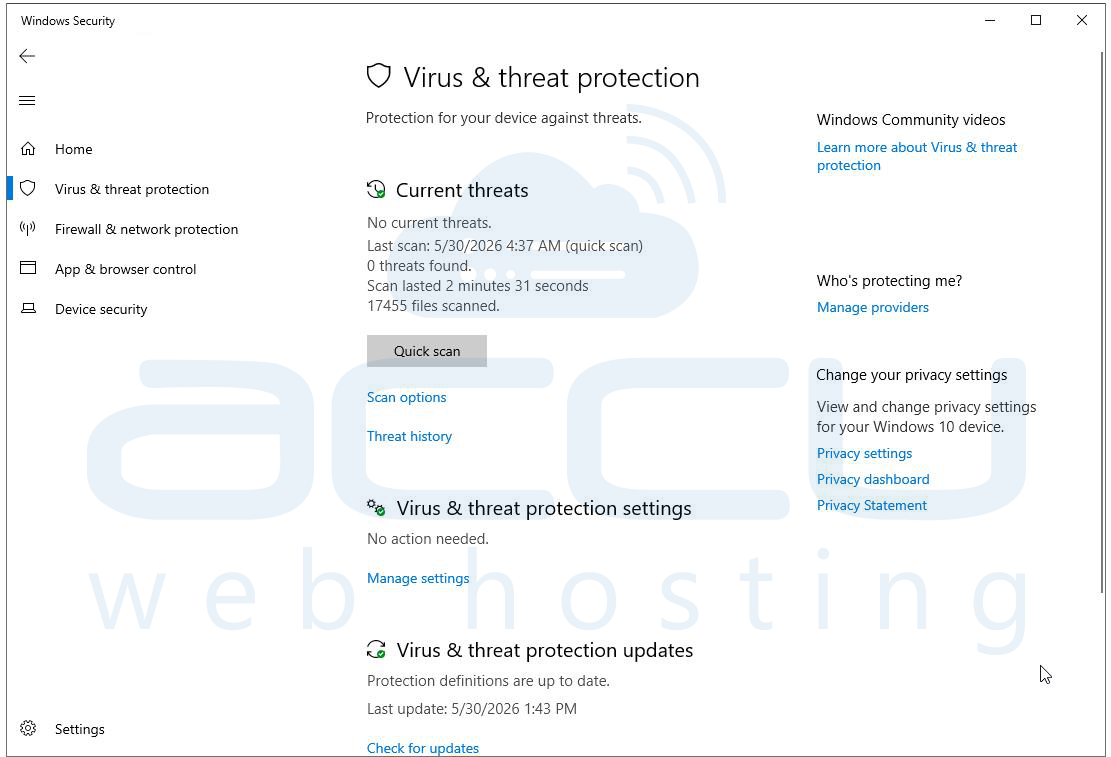
Run a full scan using Windows Defender or your installed antivirus solution. Ensure the definitions are completely up to date before scanning. While Defender has improved significantly, consider also running the Microsoft Safety Scanner (MSERT), a standalone tool that can catch threats Defender may have missed if the malware modified Defender's configurations.
Download and run Malwarebytes (the free version covers manual scans) as a second-opinion scanner. Multiple scanning tools increase your detection rate because different engines catch different threat families.

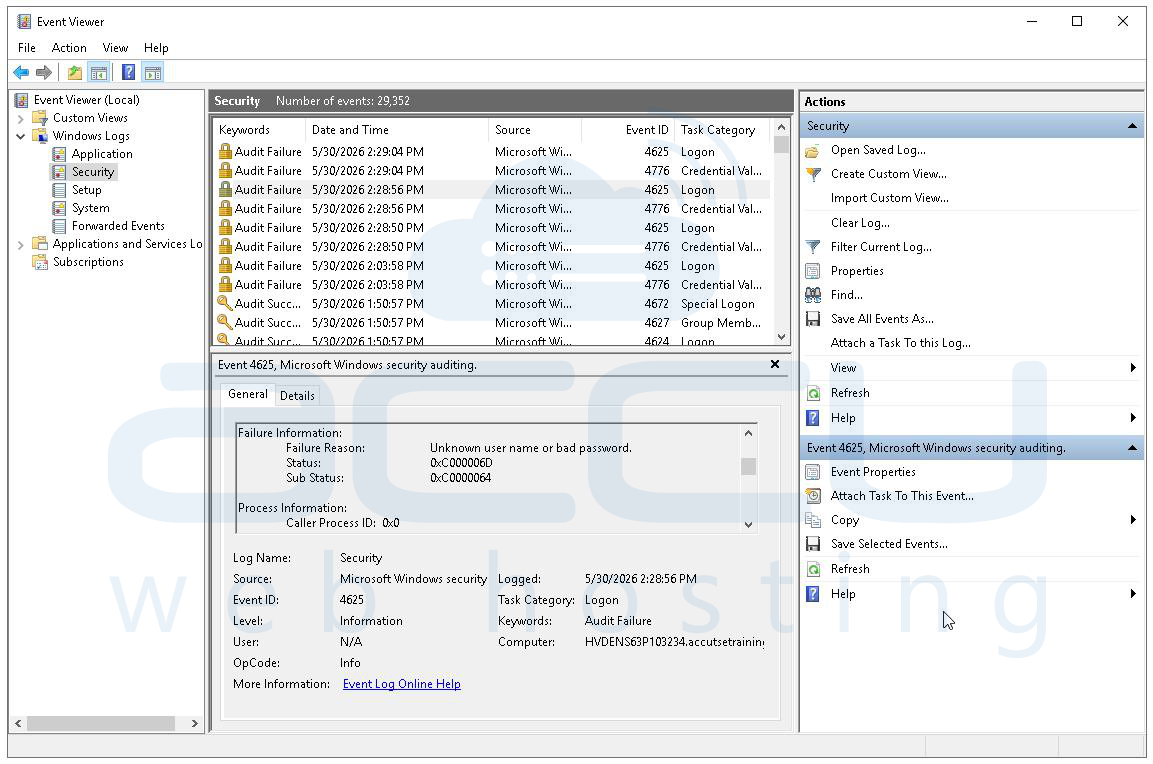
Check the Windows Event Logs for failed login attempts, particularly in Security > Windows Logs. Thousands of failed RDP login attempts indicate your server is being actively brute-forced. Even if no breach has occurred yet, the login attempt traffic itself can consume system resources. If RDP brute force is detected, immediately change RDP to a non-standard port, implement account lockout policies, and consider deploying Windows Firewall rules to whitelist specific IPs.
Solution 8: Optimize IIS, SQL Server, or Application Stack Configuration
If your Windows VPS is running a specific application stack, IIS for web serving, SQL Server for databases, or a combination, the performance problem may not be at the OS level at all. It may be entirely within the application tier, and no amount of hardware tuning will fix a misconfigured application.
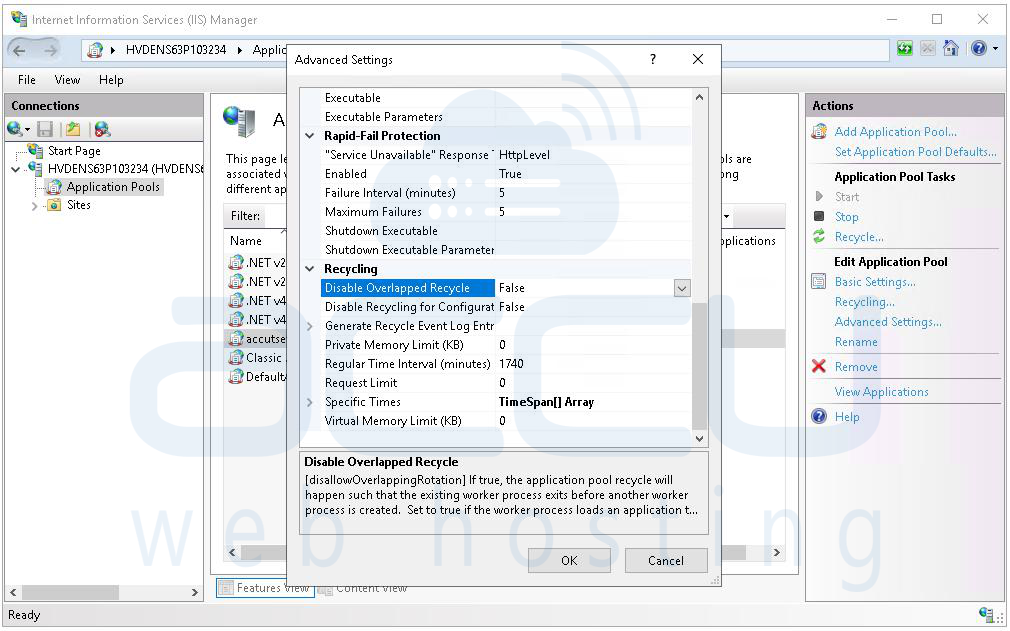
For IIS (Internet Information Services), start by reviewing Application Pool settings. Each application pool runs worker processes (w3wp.exe), and a misconfigured pool can leak memory, recycle too frequently (causing temporary unresponsiveness), or fail to handle requests efficiently.
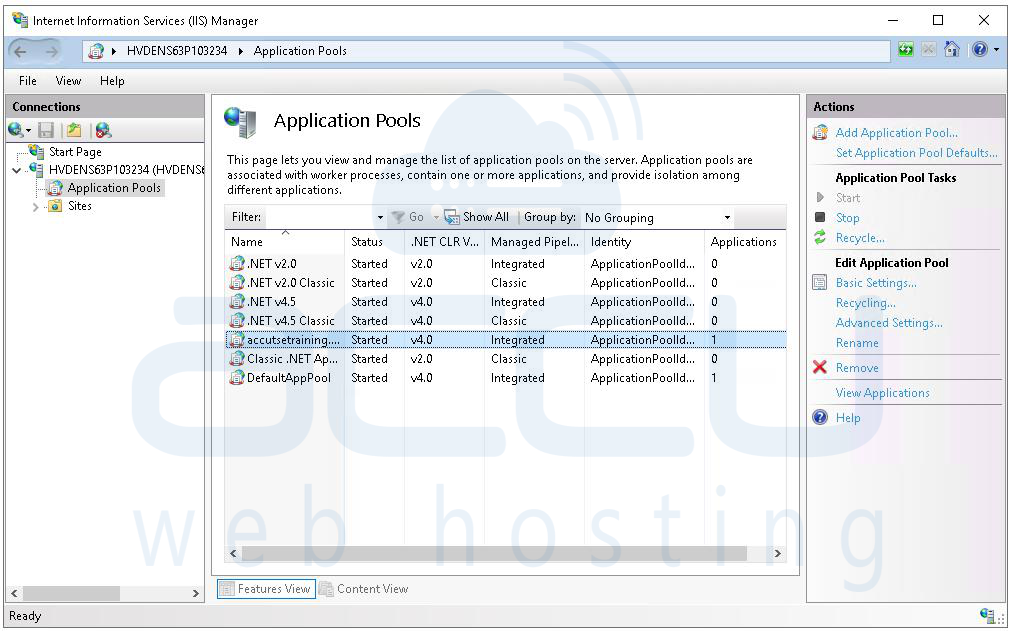
Check the Recycling settings, an app pool set to recycle on a memory limit that's too low will constantly restart, and each restart involves a brief period where requests are queued. Review the Queue Length setting under Application Pool Advanced Settings; if this is too low, IIS will reject requests when the queue fills up. Enable Failed Request Tracing to capture slow requests and identify bottlenecks within the application itself.
For SQL Server, the most common performance issues on a VPS are insufficient RAM allocation causing excessive disk reads (SQL Server loves to cache data in memory), missing indexes on frequently queried tables, and blocking queries where transactions hold locks too long.
Solution 9: Apply Pending Windows Updates and Patch Driver Issues
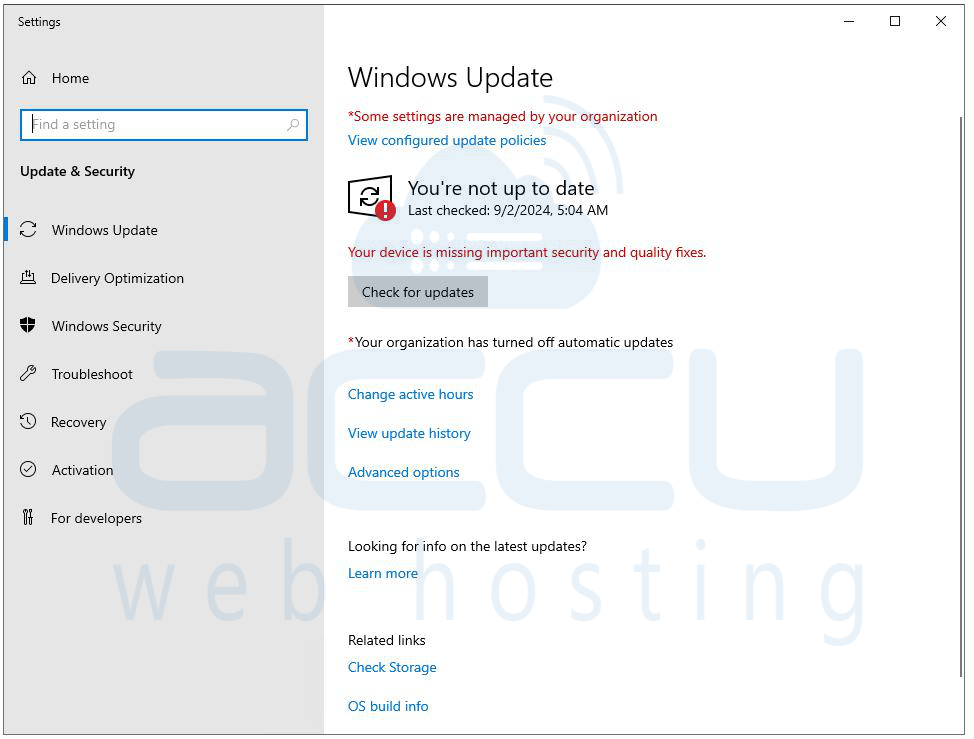
Outdated Windows Server builds can contain known bugs that cause performance degradation, and Microsoft regularly releases patches that address CPU scheduling inefficiencies, memory management bugs, and driver compatibility problems. Open Windows Update (or Server Manager > Windows Update) and check for pending updates. If there are dozens of updates waiting, the system may already be in the middle of downloading or preparing them in the background, which itself consumes significant I/O and CPU. Allow the updates to complete, reboot, and reassess performance.
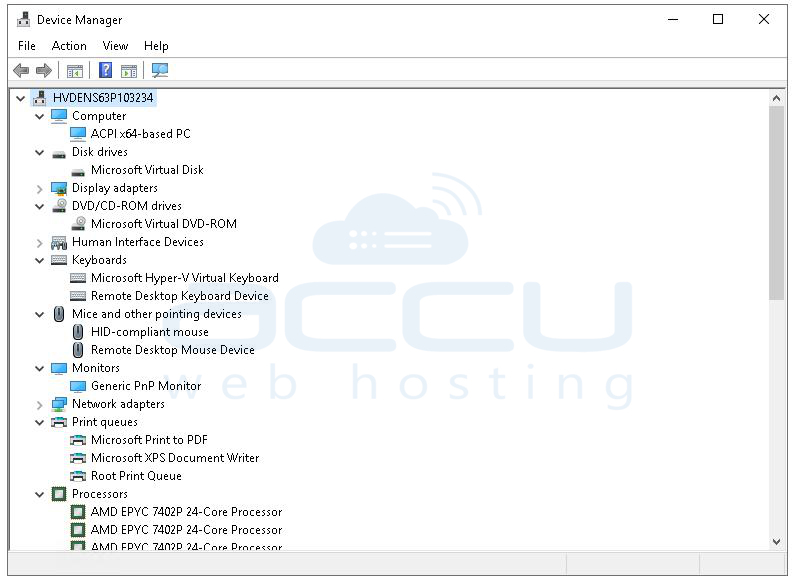
Check Device Manager for driver issues. Expand each device category and look for yellow warning triangles, these indicate driver problems that can cause excessive CPU interrupts, I/O failures, or memory access errors. Pay particular attention to the Network Adapter, Disk Controllers, and Display Adapter sections.
Solution 10: Baseline Performance Metrics, Implement Monitoring, and Consider VM Resizing
The final and most strategic step is to implement proper monitoring and documentation so future performance issues can be detected and resolved quickly. Configure Windows Performance Monitor to continuously track key metrics such as CPU usage, memory availability, disk latency, disk queue length, network throughput, and page faults.
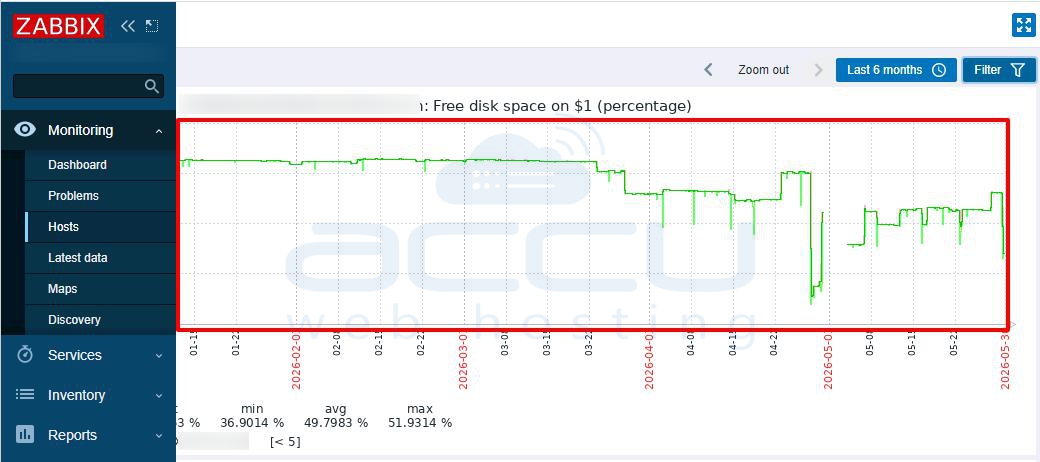
Deploy monitoring tools like Zabbix, Prometheus, or Datadog to collect historical data and generate alerts when resource thresholds are exceeded. Regularly review CPU and memory utilization trends to determine whether the current VPS resources still meet workload demands and upgrade or scale the environment if necessary. If resource usage remains consistently high and performance issues persist after optimization, consider upgrading the VPS resources such as CPU, RAM, or disk capacity, or scaling the workload across multiple servers.
Conclusion
Troubleshooting a slow Windows VPS is both a technical and methodical exercise. The fact that the underlying virtualization node is healthy is actually good news, it tells you the problem is solvable within the guest OS without needing hypervisor-level intervention. By working through these ten solutions systematically, you create a comprehensive diagnostic picture that covers every layer of the performance stack: resources, hardware emulation, OS configuration, application behavior, security posture, and long-term observability. Use this troubleshooting exercise not just as a firefighting exercise but as an opportunity to leave the system better instrumented, better configured, and more resilient than you found it.
