MTR (My Traceroute) serves as an essential network diagnostic utility that merges traceroute and ping capabilities into a single, comprehensive tool. This powerful combination allows system administrators and network engineers to identify connectivity issues, monitor packet loss, and analyze network latency with precision.
Network troubleshooting becomes significantly more efficient when you have access to detailed pathway analysis and real-time performance metrics. MTR excels in providing this level of insight by tracking data packets as they traverse multiple network hops while simultaneously measuring response times and identifying potential failure points.
Prerequisites
Before proceeding with MTR report generation, ensure your Linux system meets the following requirements:
- Root or sudo privileges for installation and certain operations
- An active internet connection for package installation
- Terminal access to your Linux system
- Basic familiarity with the command-line interface
Our Professional VPS Hosting on Linux provides full SSH access, 1 Gbps of Network Speed, and much more.
- Dedicated infrastructure
- Expert support 24/7
- Firewall, antivirus & DDoS protection
- Daily & Weekly Backups
Why Use MTR Reports? Key Use Cases
Understanding when and why to generate MTR reports is crucial for effective network management. MTR serves multiple purposes across different scenarios:
- Performance Monitoring: Establish baselines and detect latency changes.
- Connectivity Troubleshooting: Quickly identify exact failure points.
- ISP Validation: Provide evidence of provider-side issues.
- App Optimization: Reveal bottlenecks affecting performance.
- Security Investigation: Analyze anomalies and routing attacks.
- SLA Monitoring: Document performance for compliance.
- Infrastructure Planning: Assess network capacity before scaling.
Installation Process
Step 1: Update Package Repository
Begin by refreshing your system's package repository to ensure you download the latest version:
This command synchronizes your local package database with the remote repositories, ensuring access to current software versions.
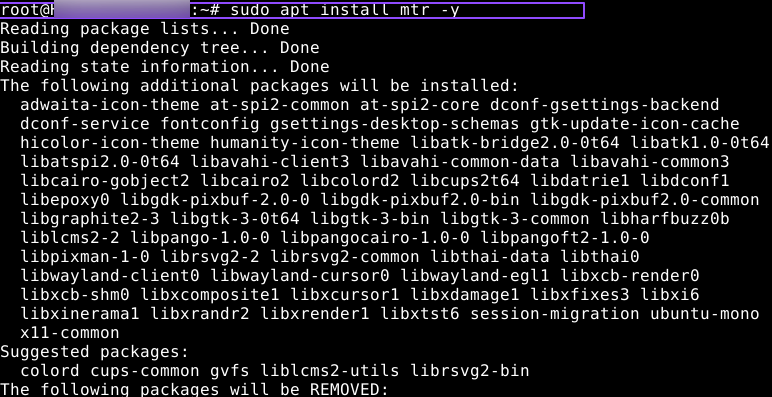
Step 2: Install MTR Package
Execute the installation command specific to your Linux distribution:
For Debian/Ubuntu systems:
For Red Hat/CentOS/Fedora systems:
For RHEL 8+ and Fedora (using dnf):
The installation process automatically handles dependencies and configures MTR for immediate use.
Step 3: Verify Installation
Confirm successful installation by checking the MTR version:
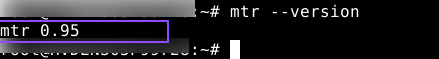
A successful installation displays version information and available options.
Basic MTR Usage
Understanding MTR Command Structure
MTR follows a straightforward syntax pattern:
The destination can be specified as either a hostname (e.g., example.com) or an IP address (e.g., 192.168.1.1).
Execute Basic MTR Test
Run a simple MTR test to observe real-time network performance:
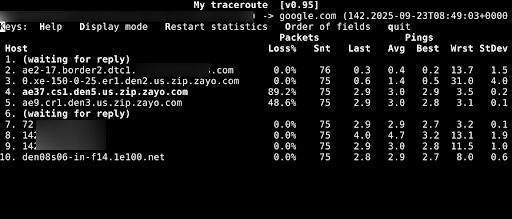
This command initiates continuous monitoring, displaying live updates of network hops, response times, and packet loss statistics—press 'q' to exit the interactive mode.
Interpreting MTR Results
Understanding Output Columns
MTR reports display several key metrics:
- HOST: Network hop hostname or IP address
- Loss%: Percentage of packets lost at each hop
- Snt: Number of packets sent
- Last: Most recent round-trip time
- Avg: Average response time across all packets
- Best: Fastest response time recorded
- Wrst: Slowest response time recorded
- StDev: Standard deviation showing response time consistency
Identifying Network Issues
High Packet Loss
Values above 1-2% at specific hops indicate potential network problems at those points.
Elevated Latency
Sudden increases in response time between consecutive hops suggest congestion or routing issues.
Route Instability
Changing hop addresses during testing reveals dynamic routing or network path modifications.
How to Generate Detailed MTR Reports?
Step 1: Create Standard Report
Generate a static report using the report mode flag:
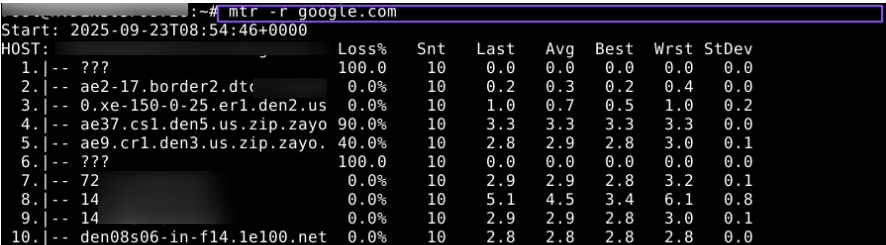
Explanation: The -r flag switches MTR from interactive mode to report mode, producing a fixed output after completing the default 10 test cycles.
Step 2: Customize Report Cycles
Modify the number of test cycles for more comprehensive data collection:
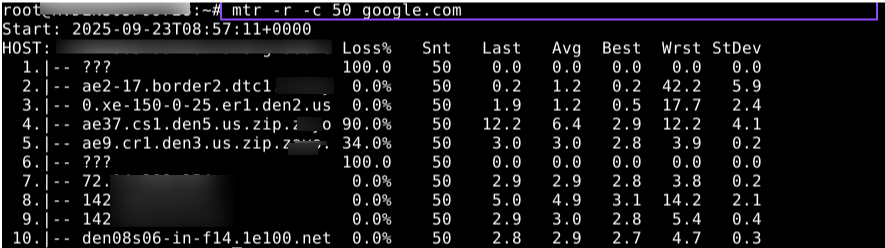
Explanation: The -c parameter specifies cycle count. Higher values provide more accurate statistics, but they require a longer execution time. For intermittent issues, use 100+ cycles.
Step 3: Generate Wide Format Report
Create detailed reports with extended metrics:
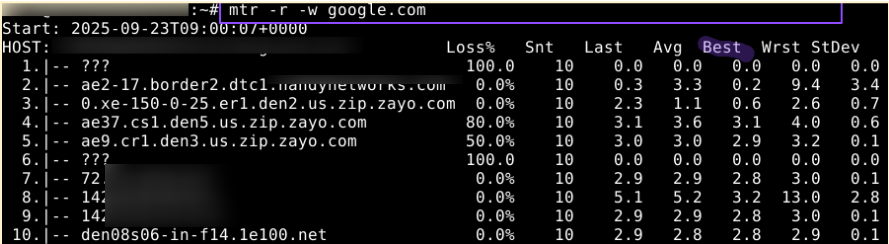
Explanation: The -w flag enables wide-format output, including additional statistical data such as standard deviation, which helps identify consistency in network performance.
Step 4: Use TCP Protocol Testing
Test using TCP packets instead of the default ICMP:
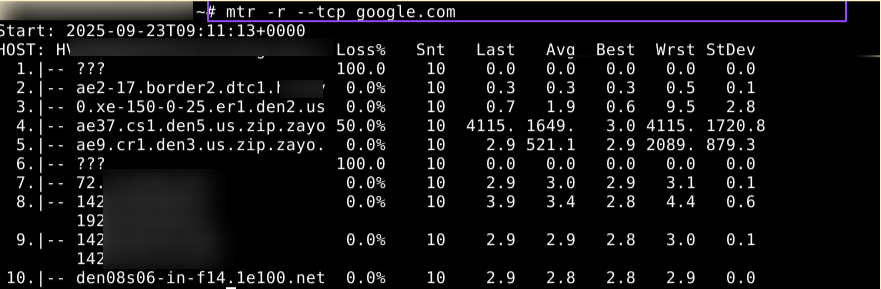
Explanation: TCP testing provides more accurate results for web services and applications that rely on TCP connections, as some networks may treat ICMP packets differently.
Step 5: Export Reports to Files
Save MTR results for documentation and analysis:
Explanation: Output redirection saves the complete report to a specified file location, enabling offline analysis, sharing with team members, or maintaining historical records.
Step 6: Advanced Report Generation
Combine multiple parameters for comprehensive analysis:
Explanation: This command combines wide-format output, extended cycle count, TCP protocol testing, and file export to create the most thorough network analysis possible.
Observations From the above Results:
Hops 1, 6 = ??? / 100% Loss
- Many routers block ICMP (Internet Control Message Protocol) for security reasons. Not necessarily a real connectivity problem.
Hops 4–5 = 50–80% packet loss
- Often seen in backbone routers* that deprioritize ICMP ping to focus on real traffic.
- Since later hops have 0% loss, this is not impacting overall connectivity.
Final hop latency
- <3ms average → super low latency. That’s excellent connectivity from your server to Google.
Overall route
- Traffic starts from our server → local ISP (Handynetworks) → backbone (Zayo) → Google edge → Google server.
A hop is one step in the path from your server to the destination. Each hop is a router, switch, or gateway forwarding packets. The first hop is your server or gateway, and the last hop is the destination server (e.g., Google).
So, “hops” are the checkpoints your data passes through across the internet.
Backbone routers are the high-capacity routers that handle massive amounts of internet traffic between networks. Their main job is to move real user data (like websites, videos, and applications) as fast as possible.
Since ICMP packets (like ping or traceroute probes) are mainly diagnostic and not actual user traffic, many backbone routers either:
- Deprioritize them → they respond slower to ICMP than to real data.
- Ignore them completely → they don’t reply at all, even though they’re still forwarding traffic normally.
Best Practices for MTR Usage
- Run Multiple Tests: Execute MTR at different times to identify patterns in network behavior.
- Document Results: Maintain records of MTR reports for trend analysis and troubleshooting history
- Use Appropriate Cycle Counts: Balance thoroughness with time constraints based on urgency.
- Test Both Directions: Run MTR from both the source and the destination when possible.
- Combine with Other Tools: Use MTR alongside ping, nslookup, and netstat for comprehensive analysis.
Conclusion
MTR represents a powerful solution for network diagnostics on Linux systems, providing detailed insights that enable rapid identification and resolution of problems. By mastering the various command options and understanding how to interpret results, administrators can maintain optimal network performance and quickly address connectivity issues.
The combination of real-time monitoring capabilities with comprehensive reporting makes MTR an indispensable tool for network management. Regular use of MTR for proactive monitoring helps prevent issues before they impact users, ensuring consistent network reliability.
