MySQL is the world's leading open-source relational database management system. Although it's optimized to be efficient right out of the box, as applications expand and data grows, performance can start to slow down.
This how-to article offers real-world steps and actionable advice for MySQL optimization to get your database running at its optimal efficiency.
Understanding MySQL Performance Bottlenecks
Before going into the optimization techniques, it's essential to understand the common areas where MySQL performance issues occur:
- Query efficiency: Poorly written or non-optimized SQL queries
- Hardware limitations: Insufficient CPU, memory, or storage resources
- Configuration settings: Suboptimal MySQL configuration parameters
- Indexing strategy: Missing or ineffective indexes
- Storage engine choice: Using a storage engine that doesn't match your workload
Hardware Optimization for MySQL
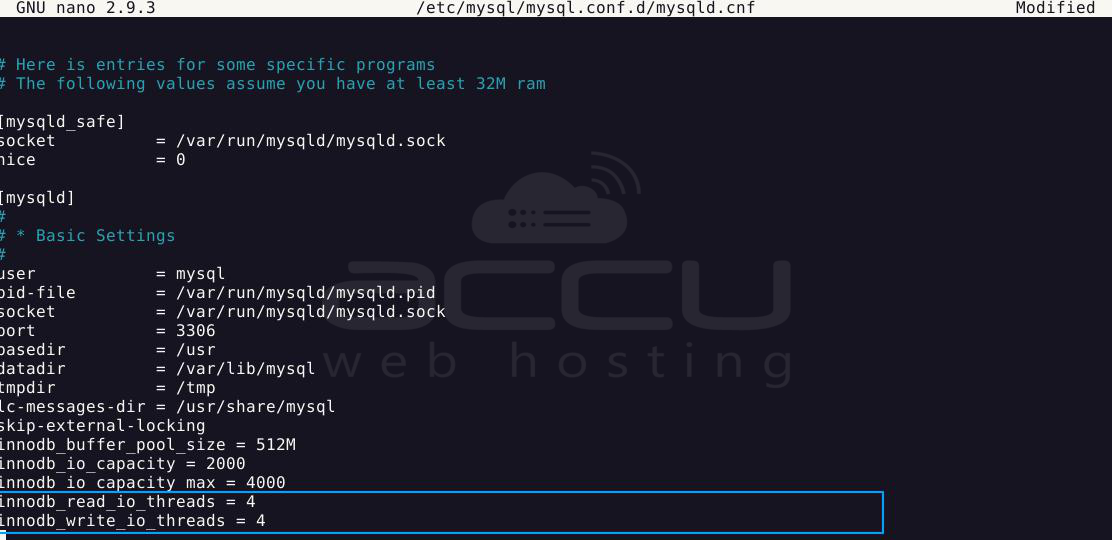
Note: Through this entire section, we will add rules into a single file (/etc/mysql/mysql.conf.d/mysqld.cnf) under the [mysqld] section. You can add Configurations all at once or one after another.
To configure the tuning techniques mentioned below, you need to edit the mysqld.conf file with the help of the below command in your command line:
# sudo nano /etc/mysql/mysql.conf.d/mysqld.cnf
RAM Configuration
Memory is one of the most critical resources for MySQL performance:
Assess your total RAM: Determine how much physical memory is available on your server with:
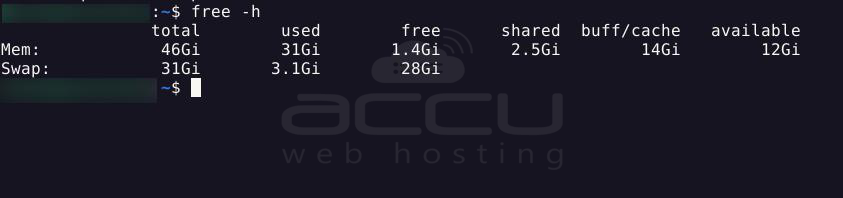
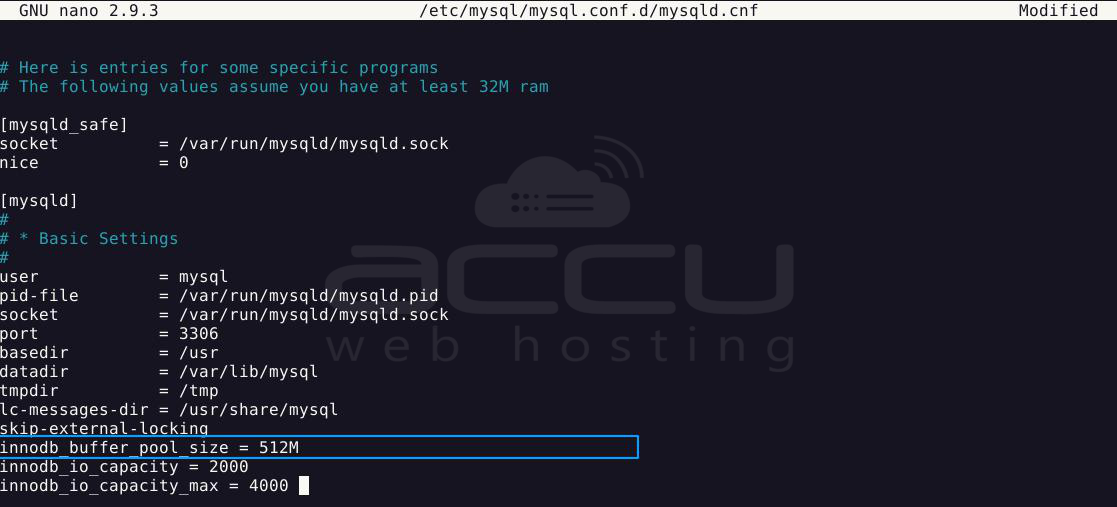
Configure buffer pool appropriately:
Innodb_buffer_pool_size is a part of RAM that MySQL uses to cache data and index pages for InnoDB tables.
The bigger this buffer pool, the faster MySQL can retrieve data without hitting the disk.
innodb_buffer_pool_size = 70% of total RAM
- For servers dedicated to MySQL, allocate 70-80% of available RAM
- For shared servers, reduce this to 50-60%
- Example: On a 16GB RAM server dedicated to MySQL, set innodb_buffer_pool_size=11G
Storage Optimization
Use SSDs when possible: Replace traditional HDDs with SSDs for significant performance gains.
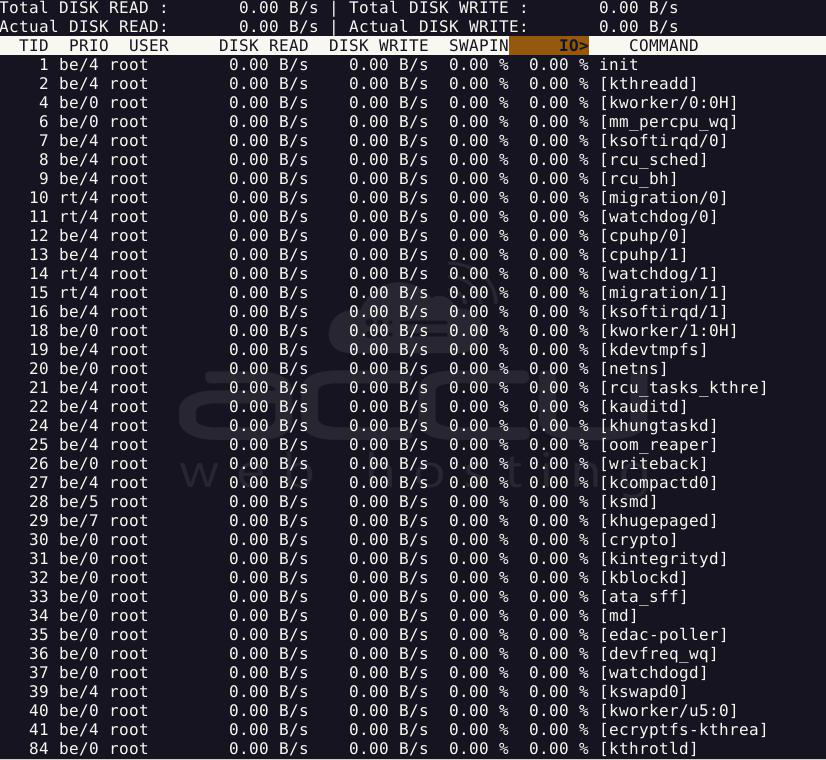
Monitor I/O rates: Use tools like iotop or sar from the sysstat package to identify disk bottlenecks.
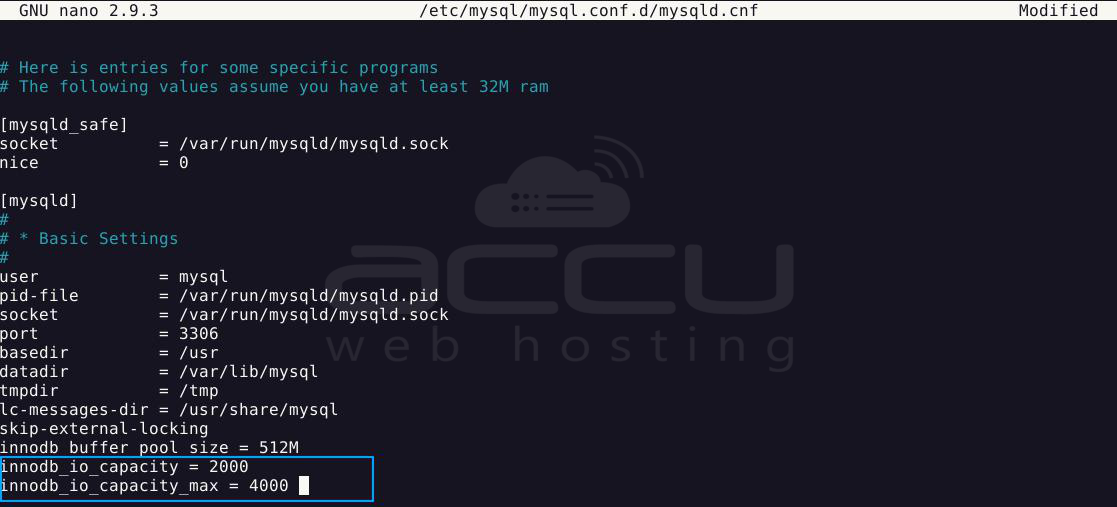
Configure I/O capacity settings:
innodb_io_capacity = [Your storage's baseline IOPS]innodb_io_capacity_max = [Your storage's max IOPS]
- For SSDs, start with values like 2000 and 4000, respectively
- For HDDs, start with values like 200 and 400, respectively
# innodb_io_capacity_max = 4000
CPU Considerations
Monitor CPU usage: Use the top command to identify MySQL processes consuming excessive CPU.
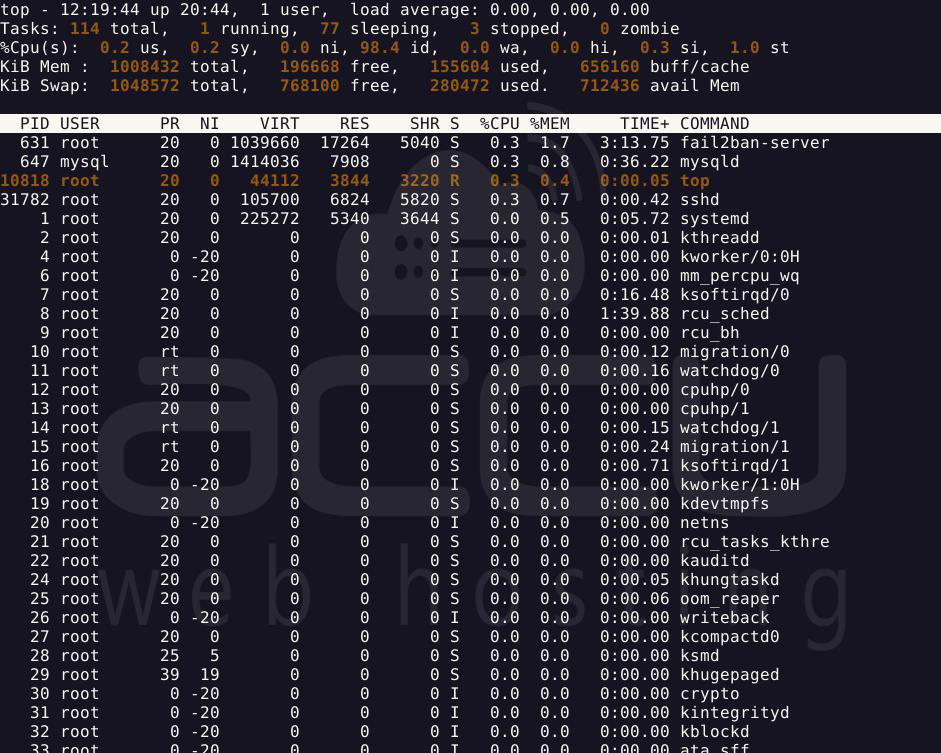
Adjust thread settings:
innodb_read_io_threads = [Number of CPU cores]innodb_write_io_threads = [Number of CPU cores]
# innodb_write_io_threads = 4
Essential MySQL Configuration Tuning
InnoDB Settings
InnoDB is the recommended storage engine for most MySQL workloads. Here are the key parameters to optimize:
Enable file per table:
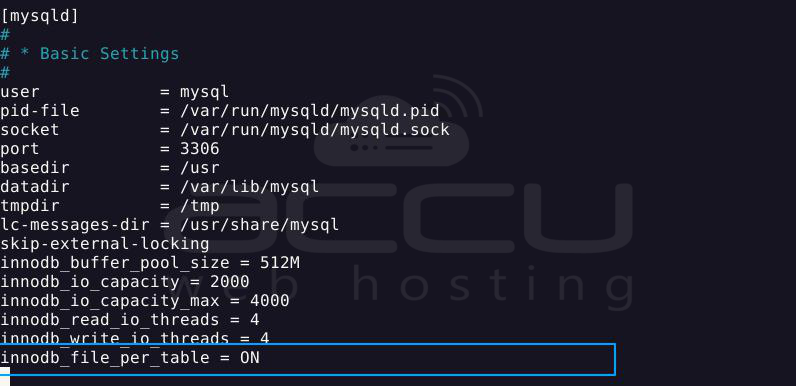
This creates separate tablespace files for each table, improving management and reducing contention.
Configure log file size:
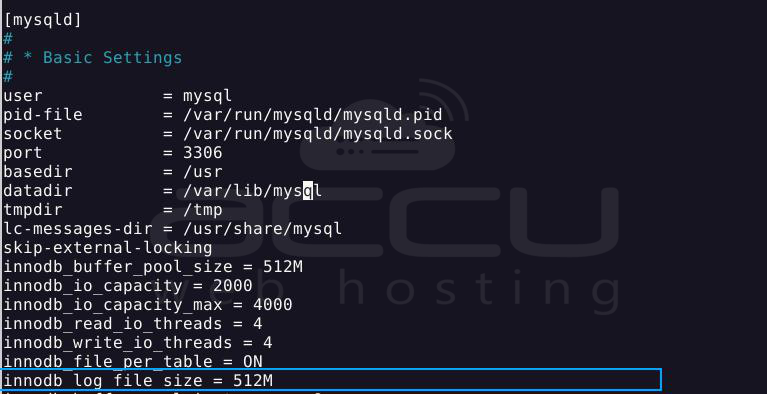
Start with values between 128M and 2G. Aim to hold approximately one hour of logs.
Set buffer pool instances:
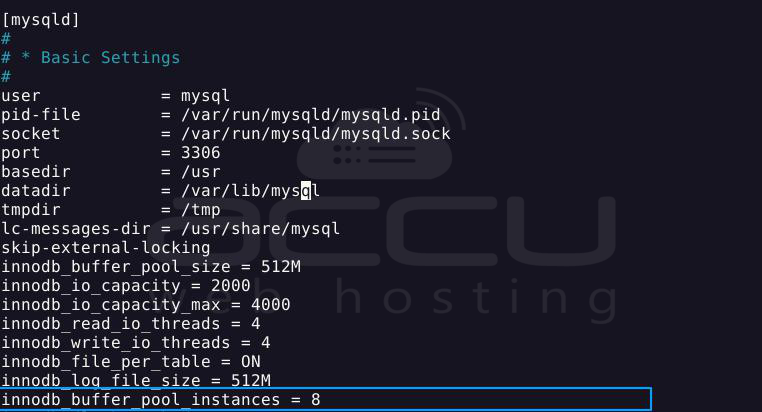
Use eight instances when buffer pool size > 1GB, otherwise use 1.
Optimize the flush method:
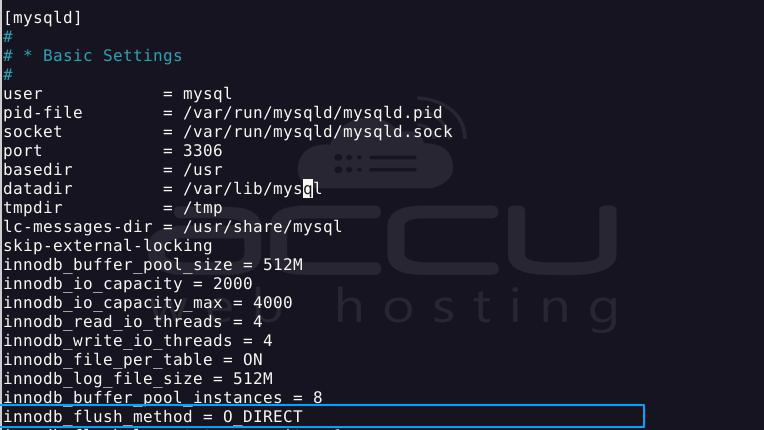
This bypasses the OS cache, avoiding double buffering penalties.
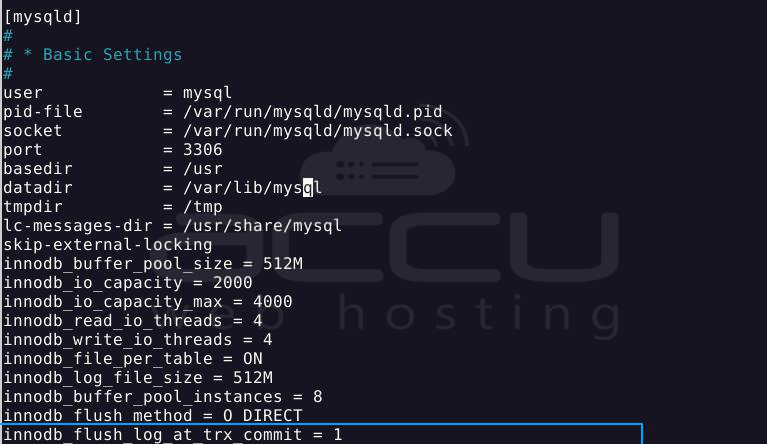
Tune transaction commit behavior:
- Value 1: Maximum durability (ACID compliant)
- Value 0 or 2: Better performance but reduced durability
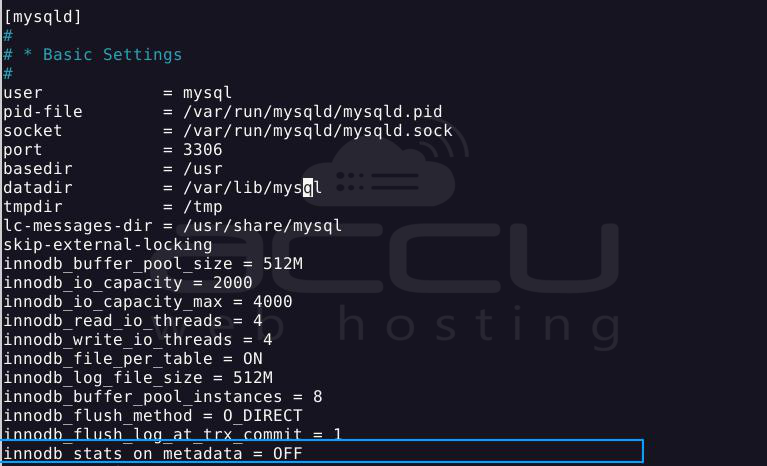
Disable unnecessary statistics updates:
This prevents statistics updates when executing metadata statements like SHOW TABLE STATUS.
Connection and Thread Management
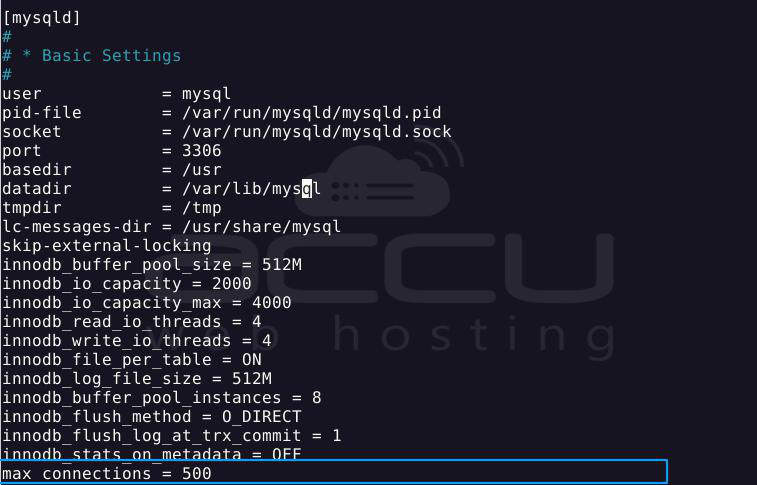
Set appropriate connection limits:
Increase this value if you encounter "Too many connections" errors.
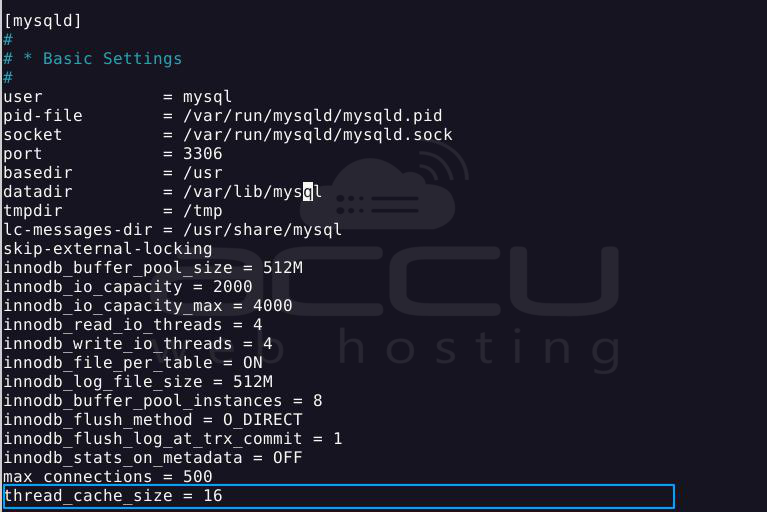
Configure thread cache:
Adjust based on the number of new connections per second.
Query Optimization Techniques
Using EXPLAIN for Query Analysis
The EXPLAIN command is your most valuable tool for query optimization:
Add EXPLAIN before your query:
EXPLAIN SELECT * FROM customer WHERE city = 'New York';
Look for these red flags in the output:
- type column showing "ALL" (full table scan)
- High values in the rows column
- Missing values in the key column
Query Rewriting Best Practices
Avoid SELECT * - specify columns:
-- Instead of:
SELECT * FROM products;
-- Use:
SELECT product_id, product_name, price FROM products;
Avoid functions in WHERE clauses:
-- Instead of:
SELECT * FROM customers WHERE UPPER(last_name) = 'SMITH';
-- Use:
SELECT * FROM customers WHERE last_name = 'Smith';
-- Or create a functional index if necessary
Avoid wildcard (%) at the beginning of LIKE:
-- Instead of (slow):
SELECT * FROM products WHERE product_name LIKE '%phone%';
-- Use (faster):
SELECT * FROM products WHERE product_name LIKE 'phone%';
Use GROUP BY instead of SELECT DISTINCT when possible:
-- Instead of:
SELECT DISTINCT department, manager_name FROM departments;
-- Use:
SELECT department, manager_name FROM departments GROUP BY department;
Indexing Strategies
Creating Effective Indexes
CREATE INDEX idx_customer_city ON customers(city);
CREATE INDEX idx_order_customer_date ON orders(customer_id, order_date);
CREATE INDEX idx_orderitems_order_id ON order_items(order_id);
Managing Indexes
SELECT
object_schema,
object_name,
index_name,
count_star
FROM performance_schema.table_io_waits_summary_by_index_usage
WHERE index_name IS NOT NULL
AND count_star = 0
ORDER BY object_schema, object_name;
ALTER TABLE table_name DROP INDEX index_name;
Caching Strategies
Configure Query Cache (for MySQL 5.7 and below)
MySQL 8.0 has removed the query cache feature. For earlier versions:
query_cache_type = 1
query_cache_size = 64M
query_cache_limit = 2M
query_cache_type = 0
query_cache_size = 0
Application-Level Caching
Implement these caching mechanisms in your application:
1. Object caching: Use Redis or Memcached to store frequently accessed data
2. Result set caching: Cache query results at the application level
3. Session caching: Store user session data outside MySQL
Monitoring and Analysis Tools
Essential Monitoring Metrics
1. Queries per second (QPS)
2. Slow query count
3. Buffer pool hit ratio
4. Disk I/O utilization
5. Connection count
Recommended Monitoring Tools
1. Percona Monitoring and Management (PMM): Comprehensive MySQL monitoring solution
2. MySQL Enterprise Monitor: Official Oracle monitoring tool
3. Prometheus with Grafana: Open-source monitoring stack with MySQL exporters
Setting Up Slow Query Logging
slow_query_log = 1
slow_query_log_file = /var/log/mysql/mysql-slow.log
long_query_time = 1
Analyze slow queries with pt-query-digest tool:
pt-query-digest /var/log/mysql/mysql-slow.log
Real-World Tuning Process
Follow this systematic approach to tune MySQL:
1. Baseline your performance: Document current metrics before making changes
2. Make one change at a time: Implement a single configuration change
3. Measure the impact: Compare performance metrics after each change
4. Document findings: Keep a log of changes and their effects
5. Iterate: Continue the process, focusing on the most significant bottlenecks first
Advanced Optimization Techniques
Partitioning Large Tables
ALTER TABLE large_table PARTITION BY RANGE (YEAR(transaction_date)) (
PARTITION p2022 VALUES LESS THAN (2023),
PARTITION p2023 VALUES LESS THAN (2024),
PARTITION p2024 VALUES LESS THAN (2025),
PARTITION future VALUES LESS THAN MAXVALUE
);
Using Stored Procedures for Complex Operations
DELIMITER //
CREATE PROCEDURE process_monthly_reports(IN month_param INT, IN year_param INT)
BEGIN
-- Complex processing logic here
-- Using optimized queries and temporary tables
END //
DELIMITER ;
Implementing Connection Pooling
Use connection pooling in your application to reduce the overhead of creating new connections:
- PHP: PDO Persistent Connections
- Java: HikariCP, DBCP
- Python: SQLAlchemy connection pooling
- Node.js: mysql2 pool
By applying these practical MySQL optimization suggestions, you can considerably enhance your database performance, reduce resource usage, and create a better app user experience.


