We can check the total CPU usage of the HyperV node from the Hyper-V Logical Processor. Most techs look at Task Manager when they have performance issues. Note that Windows Task Manager does not show actual CPU usage.
To check the actual CPU utilization, check the Hyper-V logical processors by following these steps:
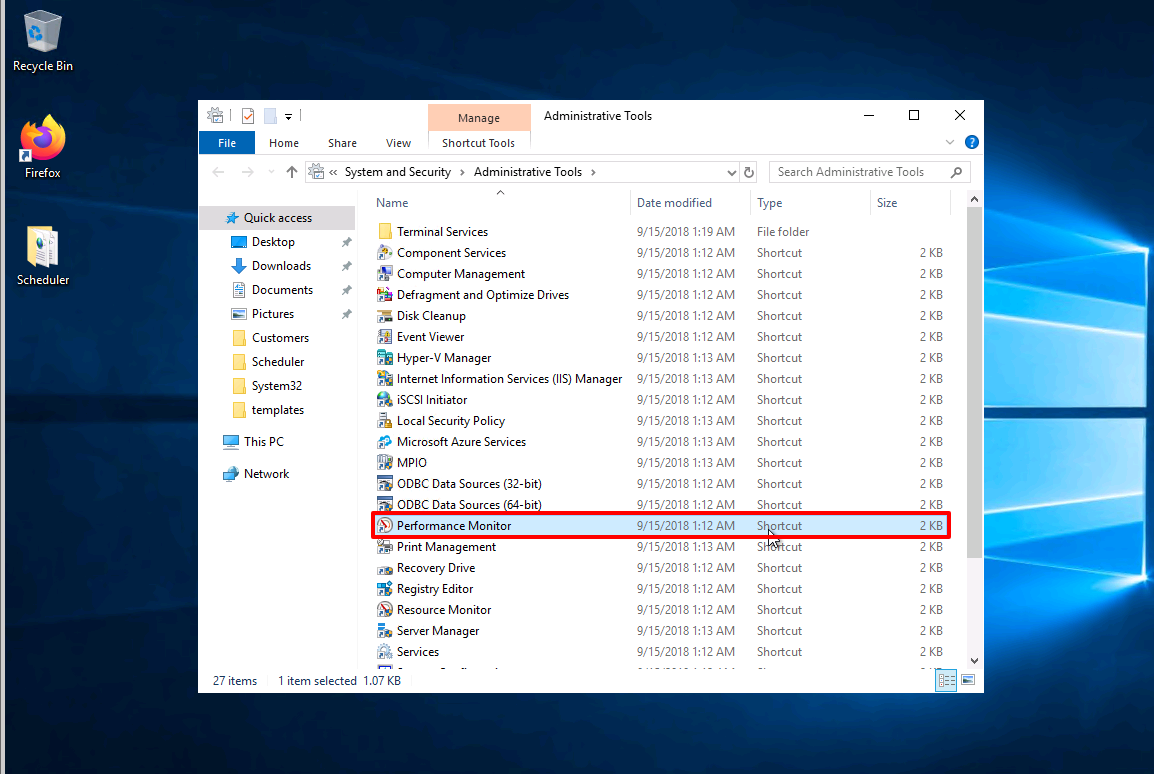
Step 1. Click on the Start button -> Administrative tools.
Step 2: Locate Performance Monitor and double-click on it to open it.
Step 3: In the Performance Monitor window, expand the Monitoring Tools and select the Performance Monitor option.
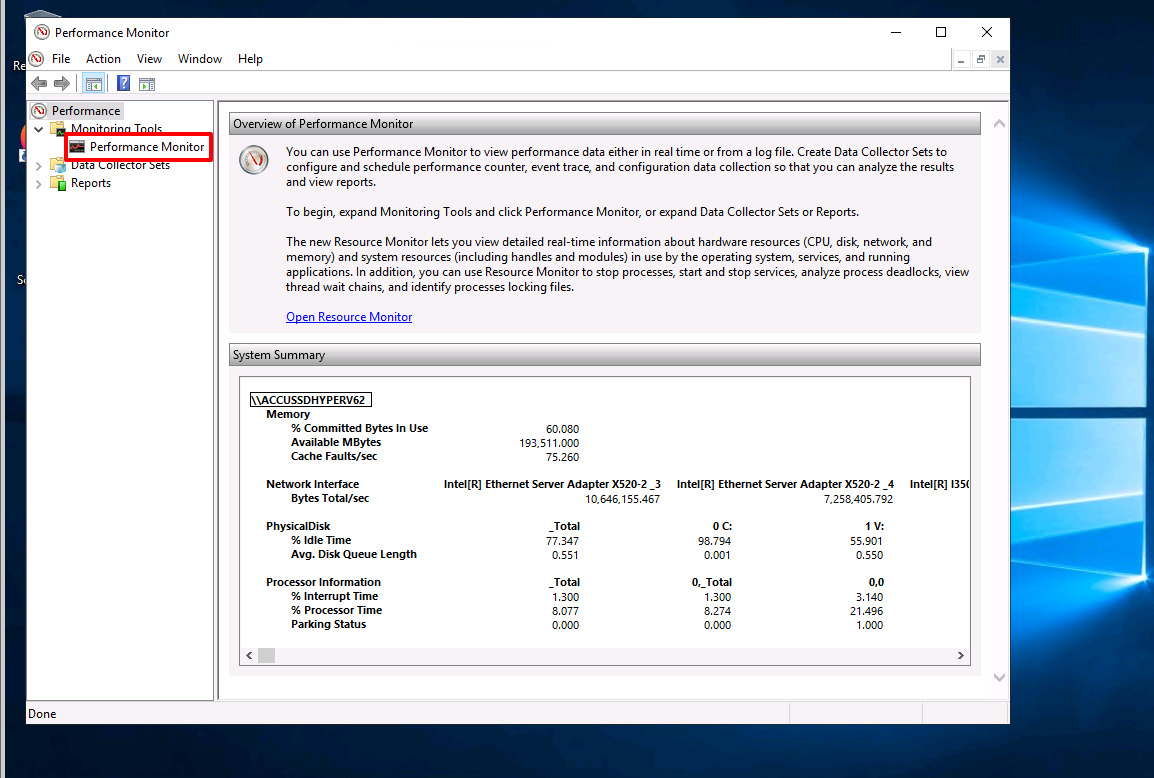
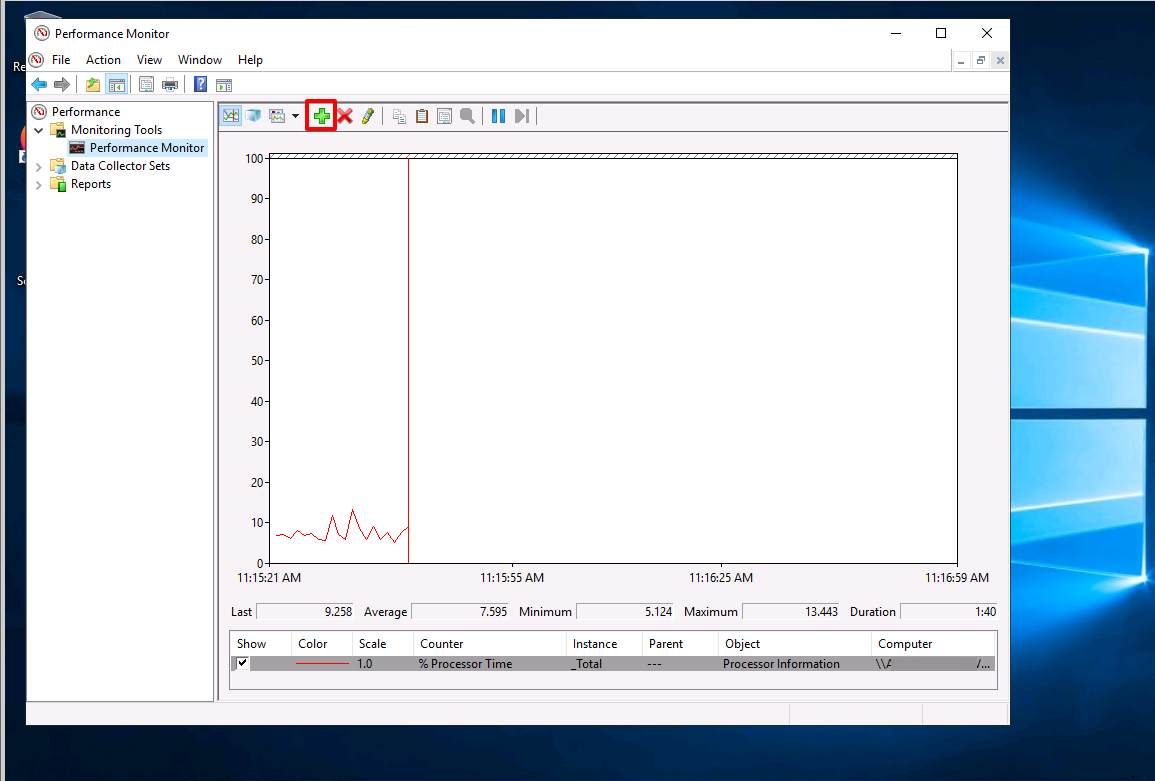
Step 4: By default, this window shows the actual processor time in %.
Step 5: Click on the Plus sign (+) to see the Total CPU usage of the HyperV node.
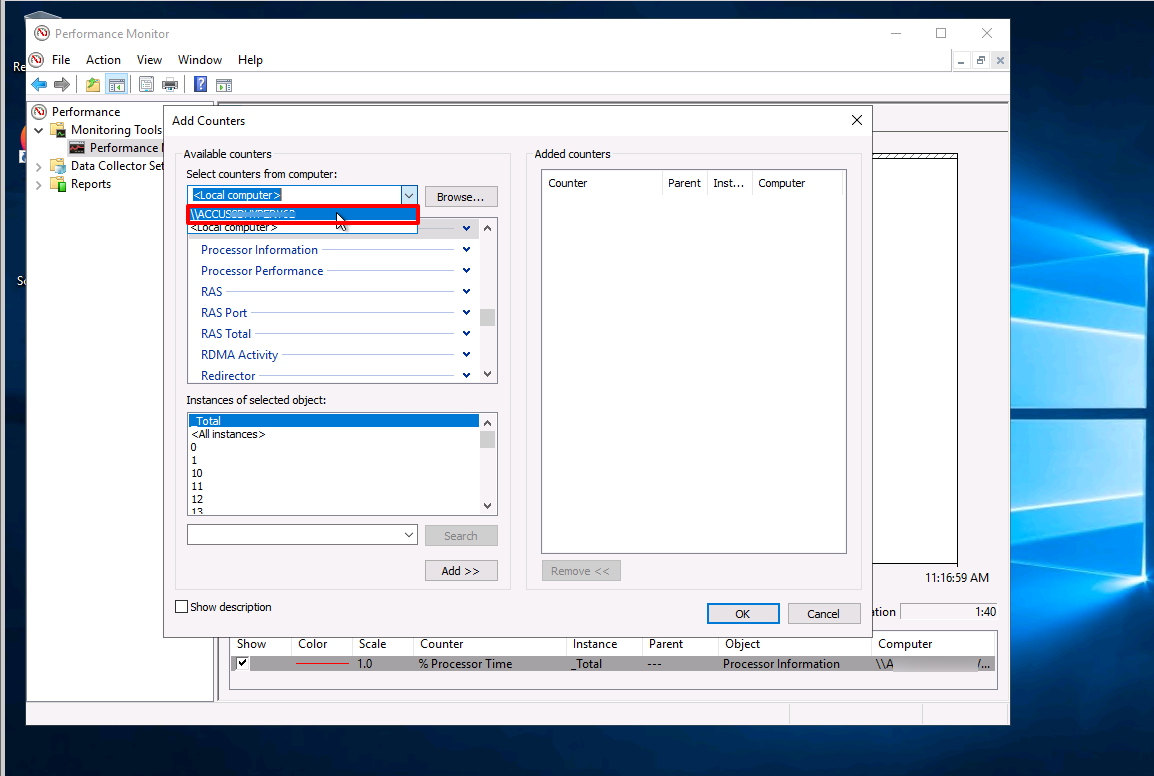
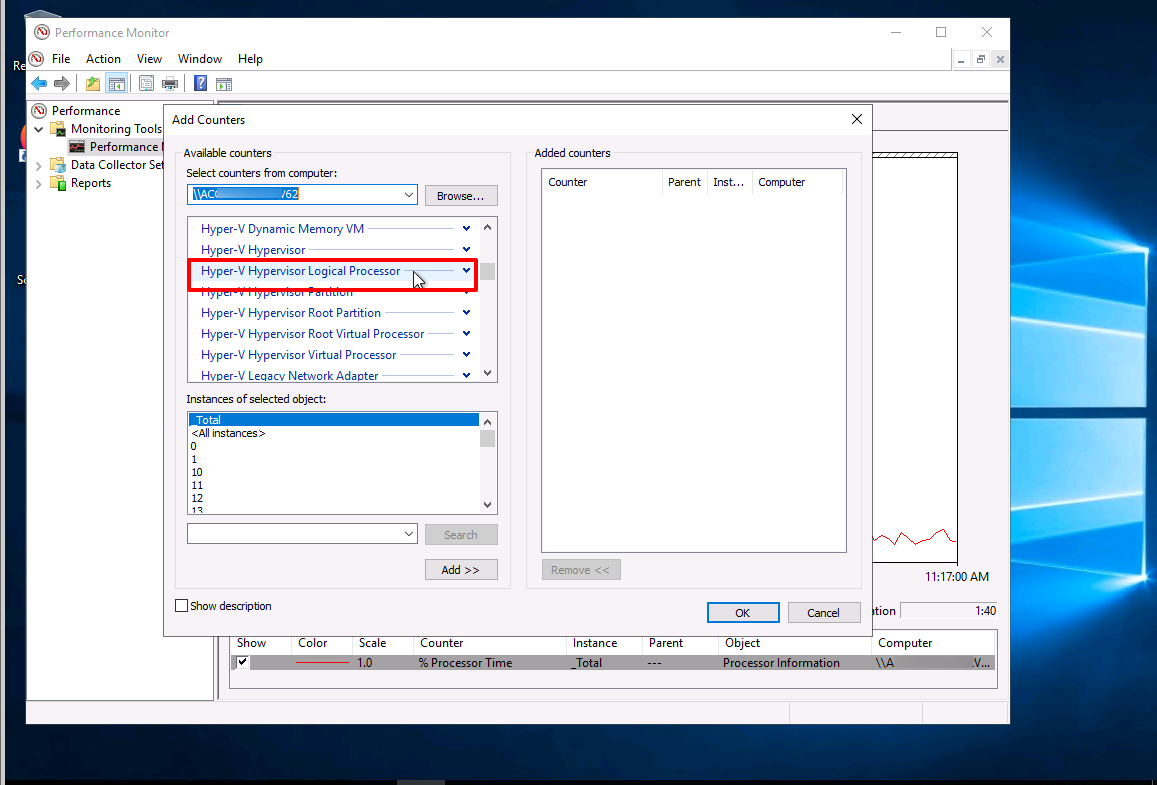
Step 6: Once you click on it, a window will be opened with the name Add Counters. Select HyperV Server from the drop-down list. If you cannot find your server in the dropdown box, click the Browse... button to search for the appropriate server.
Step 7: After selecting the appropriate server, select the Hyper-V Hypervisor Logical Processor option from the list and click the down arrow icon to reveal sub-options.
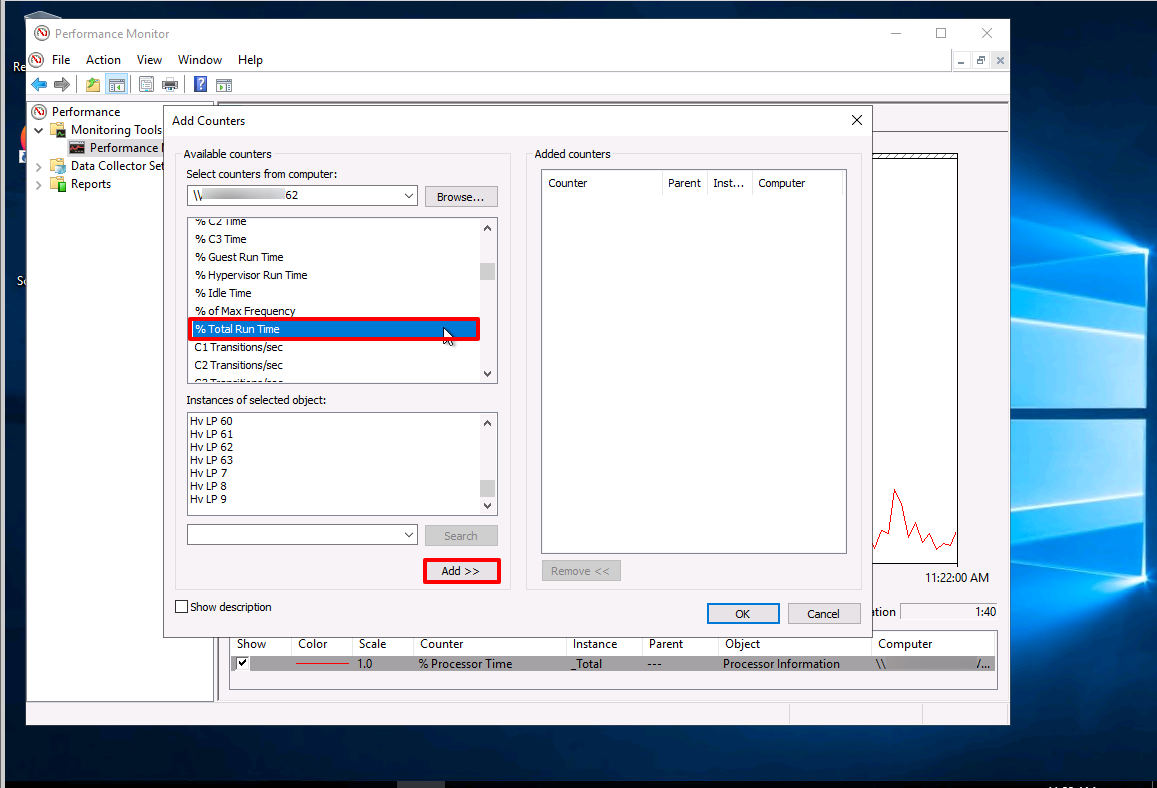
Step 8: Select the % Total Run Time option and click on Add >> button.
Step 9: By clicking on it, you will see % Total Run Time option added in the Added Counters section.
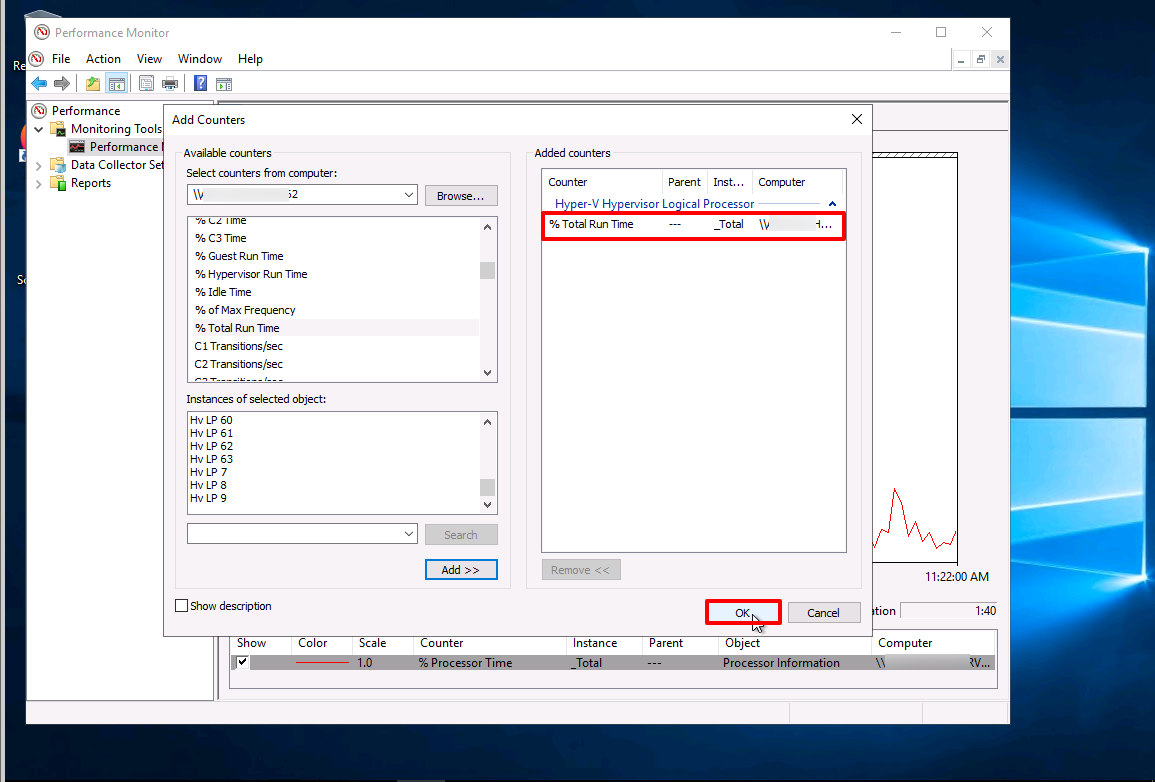
Step 10: Click on the Okay button to see the total CPU usage of the HyperV node.
Step 11: You can see the graphics about it. You can change the color and size of the line by double-clicking on specific options from below.
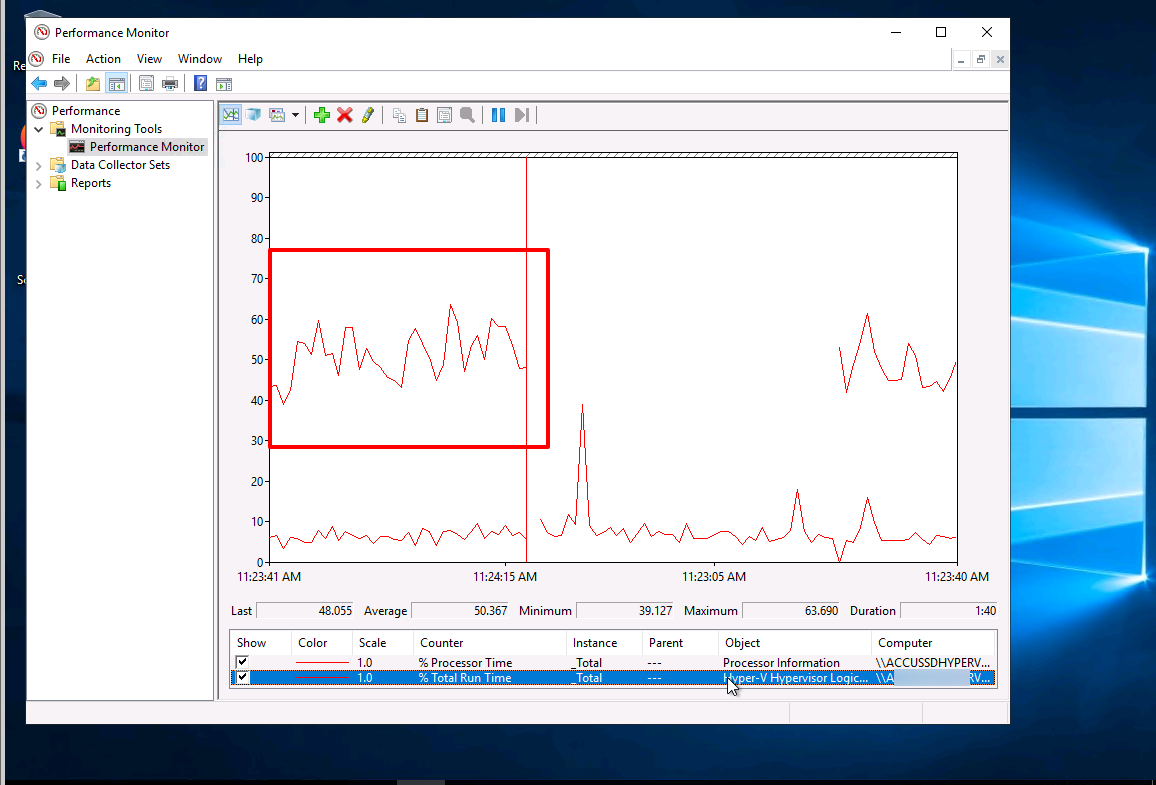
-> CPU utilization is average when the total runtime is less than 60%.
-> If it is between 60% and 89%, CPU utilization is in a monitor or caution state.
-> However, if you find it over 90%, you are in a critical condition, and server performance is impacted.
That's all.
