Monitoring memory usage in Linux is essential for maintaining server performance, diagnosing issues, and preventing outages. Linux provides several built-in commands to check both real-time and historical memory usage, identify memory-intensive processes, and troubleshoot problems like out-of-memory errors. This guide covers the most effective commands and their typical outputs.
Please refer to the list of commands below to check memory usage in Linux
Step 1: grep
You can use the grep command to search through all log files in the /var/log/ directory for any out-of-memory errors.
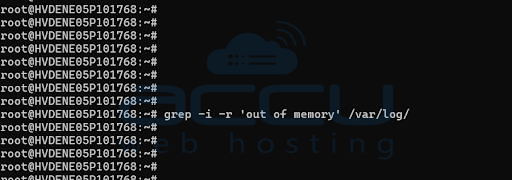
You can use the above command syntax to detect out-of-memory errors, as shown in the image above. Since there are no out-of-memory errors, the result is not displayed.
The grep command is useful for quickly locating specific keywords or phrases within logs or documents.
Step 2: free -m
Display Memory Summary Using free -m

Total: Shows the total physical RAM installed on the system.
Used: Indicates the memory currently used by the system, including processes, buffers, and the kernel.
Free: Represents the completely unused memory.
Shared: Displays the amount of memory shared between processes.
Buffers/Cache: Refers to memory used for temporary caching by the kernel. This memory can be freed when needed by active processes.
Available: This is a key metric—it shows the memory that is available for new applications, taking into account reclaimable cache and buffers.
Step 3: sar
View Historical Memory Data with sar
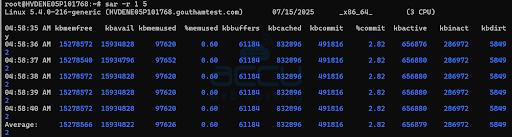
Note: If the sar (System Activity Report) is not installed, add instructions to install it
Debian/Ubuntu
# sudo apt install sysstat
RHEL/Fedora
# sudo dnf install sysstat
It collects, reports, and stores system activity information over time. sar Monitors CPU usage, Memory usage, Disk I/O, Network throughput. sar displays historical performance data collected by the system. This is useful for analyzing performance trends, identifying recurring issues, or troubleshooting problems that have happened in the past.
Step 4: top -c
Monitor Real-Time Memory Usage with top -c
The top command provides a dynamic, real-time view of running processes and their memory consumption.
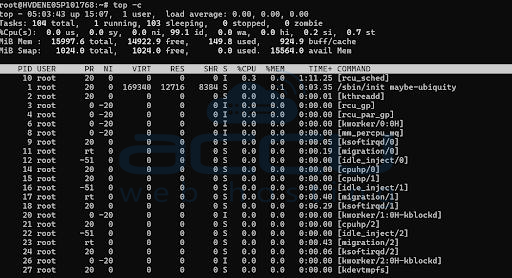
This launches the top command with full command-line details for each process.
top Displays a Real-time view of Running processes, CPU and memory usage, Load average, Uptime, and Swap usage
The -c flag shows the full command-line arguments used to launch each process.
This helps distinguish between similar processes and understand exactly what each one is doing.
Use top -c to spot processes that are consuming excessive memory or CPU. Helps in real-time troubleshooting and performance management
You can take action directly from the top (e.g., kill a process by pressing k). Ideal for monitoring and tuning performance during peak load or unusual activity.
Conclusion:
Linux offers a variety of powerful commands to monitor and troubleshoot memory usage. By mastering tools like free, top, sar, and log analysis with grep, you can quickly identify memory bottlenecks, optimize system performance, and prevent downtime. Regularly checking memory stats and process usage helps maintain a healthy server environment
