By default, when you access the IIS server website locally, you will see detailed error messages. However, for remote requests, a custom error page will be displayed. This setup is intended to increase security, as technical problems can potentially expose sensitive information about servers and websites. The following article explains how to enable detailed error messages in IIS, which will allow you to view specific error messages for debugging or development purposes.
Why are detailed errors important?
In order to properly troubleshoot an issue with a website hosted on an IIS server, detailed errors are necessary. The custom error page displays an error message, which is typically unclear. Please see the following screenshots:
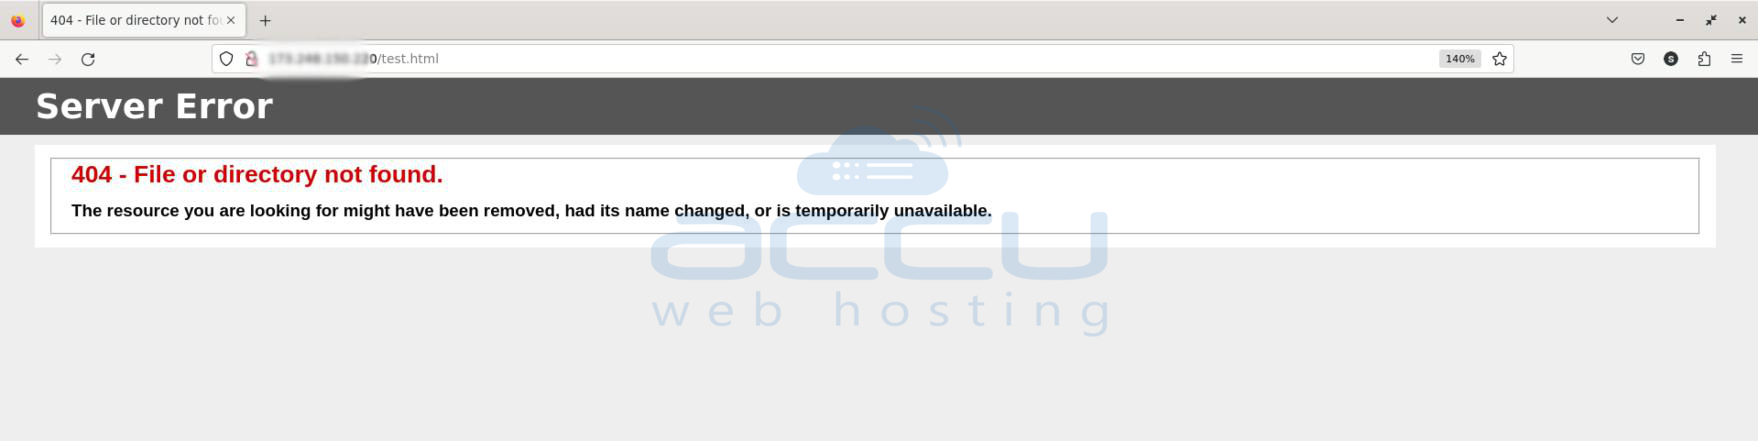
The above screenshot shows a 404 - File or directory not found. The file or directory could not be located error is displayed by IIS. For website administrators, it is not particularly useful. Let's look at the below screenshot:
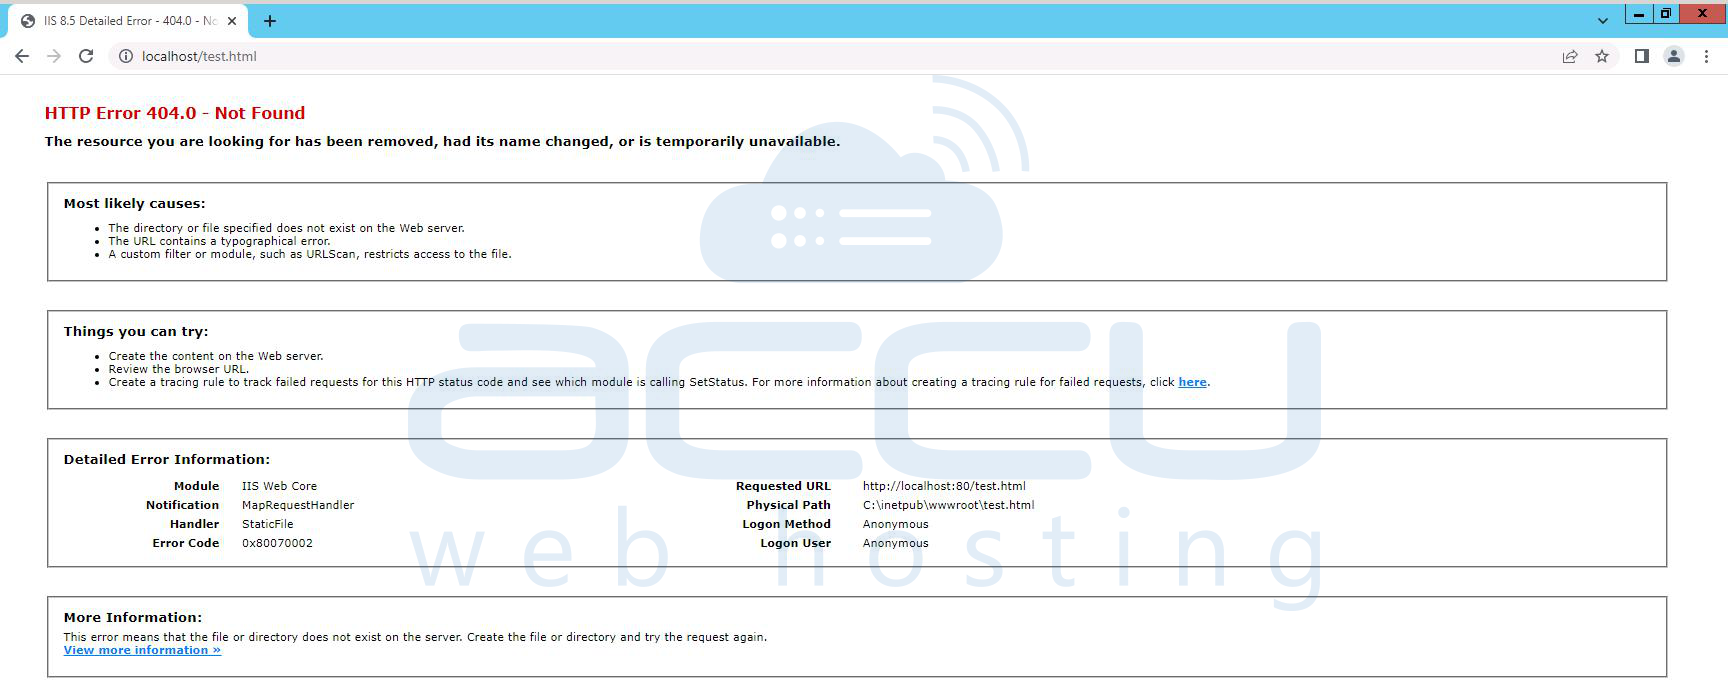
The above screenshot shows the same error when detailed error mode is enabled. It details important data that website owners can use to identify and fix the root cause of problems.
Steps to Enable Detailed Errors using the IIS Manager
You may have observed that debugging classic ASP apps is challenging. ASP settings are different from .NET settings. You can override IIS' default behavior and instruct it to give debugging information to the browser.
Step 1: Login into your server.
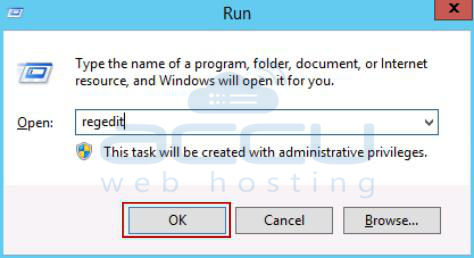
Step 2: Press WinKey+R, type inetmgr, and press Enter to launch the IIS manager.
Step 3: Choose the website by clicking on its name.
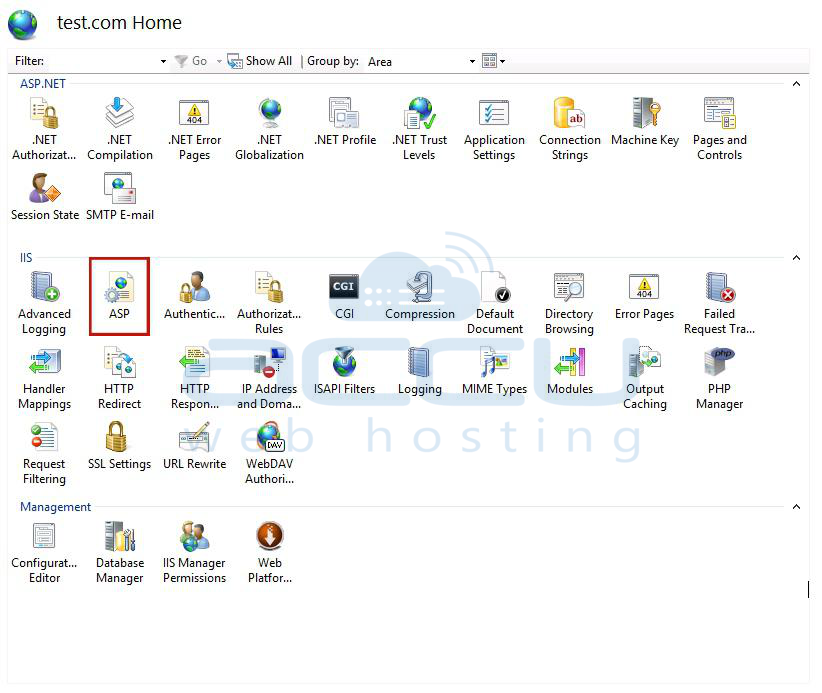
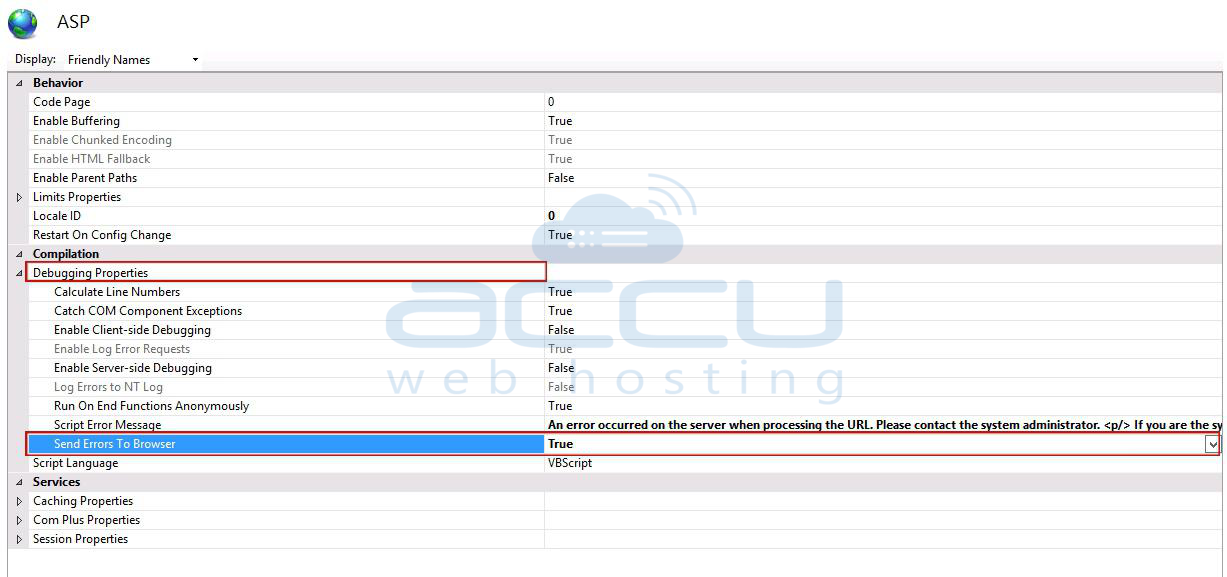
Step 4: Double-click on "ASP”.
Step 5: Expand "Debugging Properties".
Step 6: Change the "Send Errors to Browser” property to "Yes".
Step 7: Click on Apply under the Actions tab.
To enable detailed errors follow the below steps:
Step 1: Login into your server.
Step 2: Press WinKey+R, type inetmgr, and press OK to launch the IIS manager.
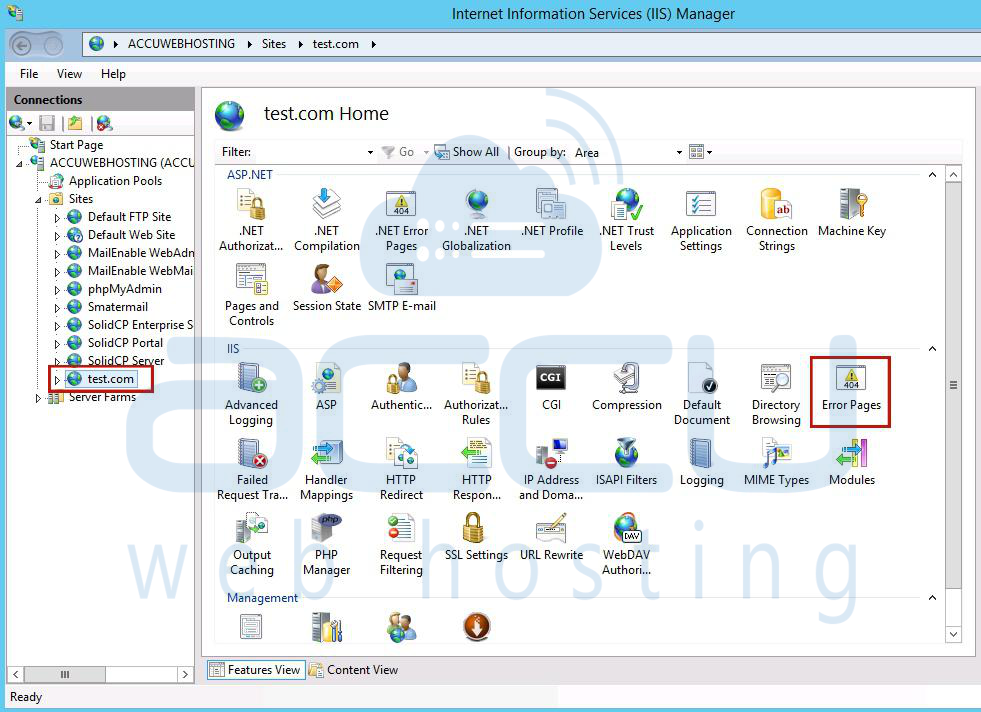
Step 3: Expand the Sites folder and choose the website you wish to enable detailed errors for.
Step 4: Double-click Error Pages in the Features View's IIS section.
Step 5: There are three choices available under Error Responses:
- Custom error pages
- Detailed errors
- Detailed errors for local requests and custom error pages for remote requests (default)
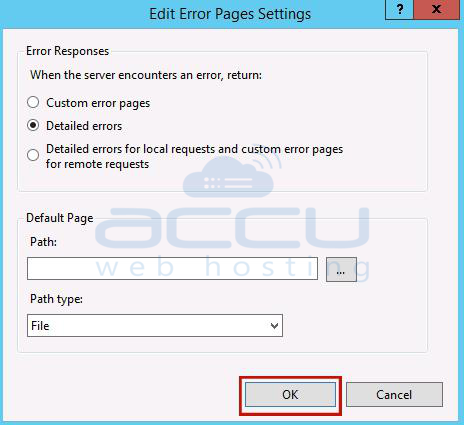
Step 6: Choose the second or third option at this point, then click OK.
The third choice is the greatest because you may use a remote desktop to directly access the web server. You can now use the server's web browser and attempt to load the affected webpage to view a detailed error page with additional technical details.
Steps to Enable detailed errors using the web.config file
There are some cases when you cannot enable detailed errors using the IIS manager. For example, you won't have access to the IIS manager if your website is hosted on a shared hosting platform. You can enable detailed errors using the web.config file in the root directory of the website. Simply add the following line to the <system.webServer> tag:
<configuration>
<system.webServer>
<httpErrors errorMode="Detailed" />
</system.webServer >
</configuration>
By adding this line to the web.config file, you force IIS to throw detailed errors for local and remote requests.
Conclusion:
Congratulations! You have successfully enabled detailed error from IIS so you can view the actual error. It's important to note that detailed errors can be extremely helpful for debugging site code in classic ASP, as the error messages can provide valuable information about the issue at hand and assist in resolving various coding problems.
However, it's crucial to exercise caution when using detailed errors on a production site, as the information displayed on the error page can potentially expose how your code functions and handles data, posing a security risk. We strongly recommend enabling detailed errors only for sites that are in development or experiencing issues, and disabling them for live sites that are functioning normally.
