High I/O wait (iowait) is a common Linux performance issue where CPUs stay idle while waiting for disk or storage operations to finish. Although the CPU is not overloaded, high iowait can slow applications, increase latency, and even cause outages. This guide explains what iowait means, the main causes behind it, and practical solutions to fix it based on your environment and requirements.

What Is I/O Wait, Exactly?
Before diagnosing anything, you must understand what the metric means. The Linux kernel tracks CPU time in several buckets. The iowait bucket increments when:
-
At least one I/O request is outstanding (pending disk or network block device read/write).
-
The CPU has no other runnable task to execute.
This means iowait is an opportunity cost metric. It tells you the percentage of time the CPU could have been doing useful work but had nothing to run because everything was blocked on I/O. A 30% iowait does not mean 30% of your disk bandwidth is wasted, it means 30% of CPU cycles went unused while storage requests were in flight.
How to observe iowait:
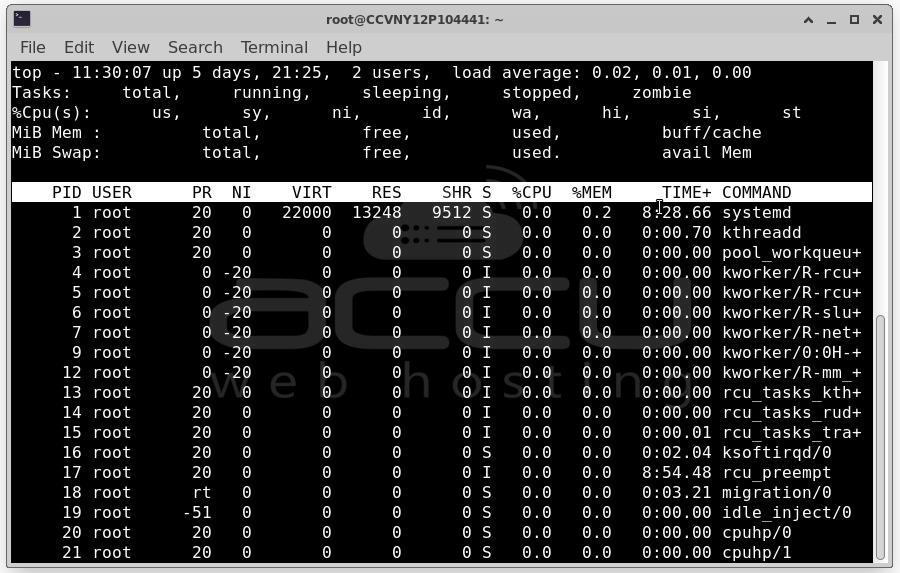
top - look at the 'wa' field in the CPU line: top
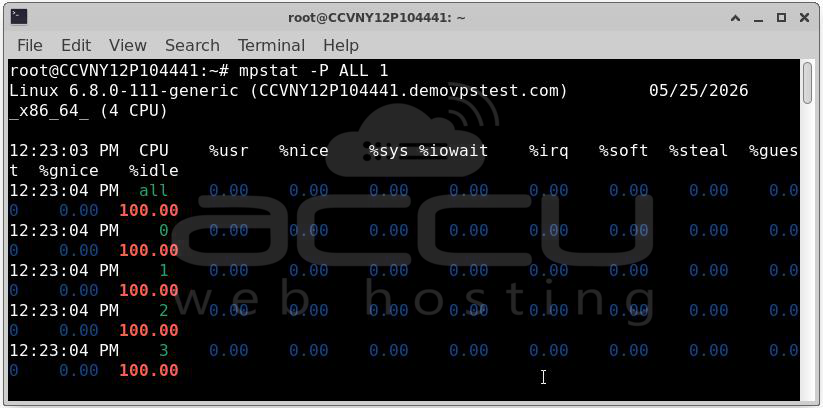
mpstat - per-CPU iowait breakdown: mpstat -P ALL 1
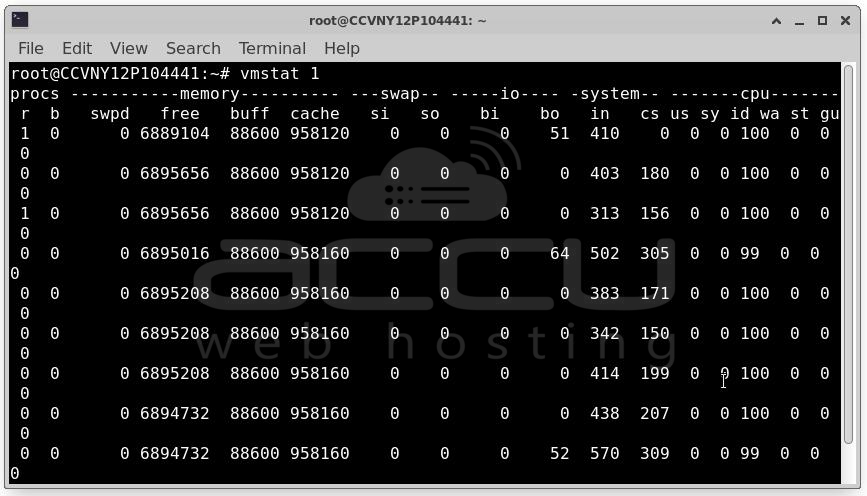
vmstat - system-wide view including I/O: vmstat 1
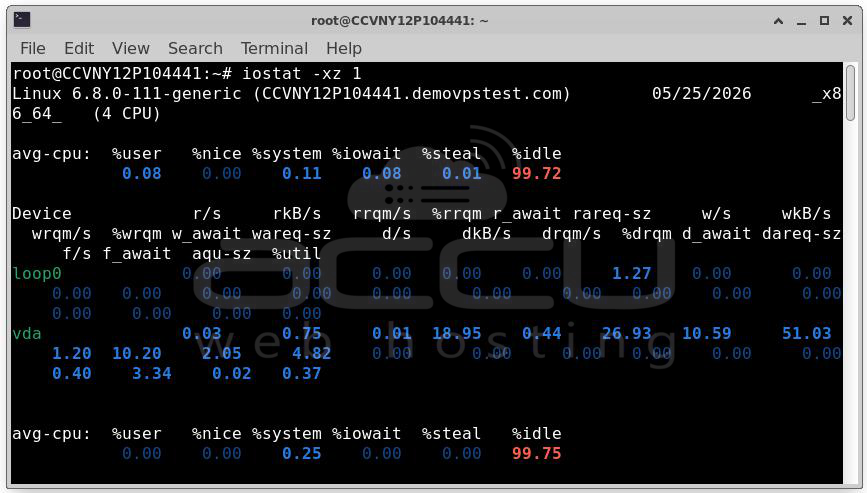
iostat - disk-level throughput and latency: iostat -xz 1
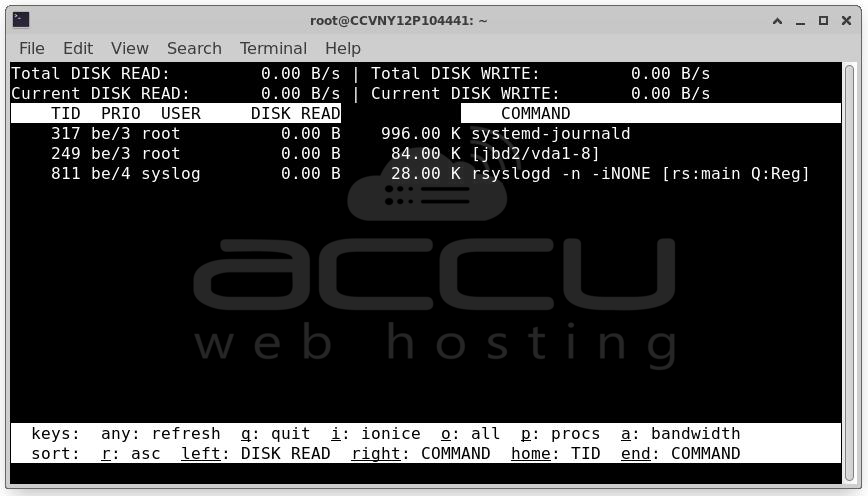
iotop - per-process I/O activity (like top, for disk): iotop -ao
pidstat - per-process I/O stats: pidstat -d 1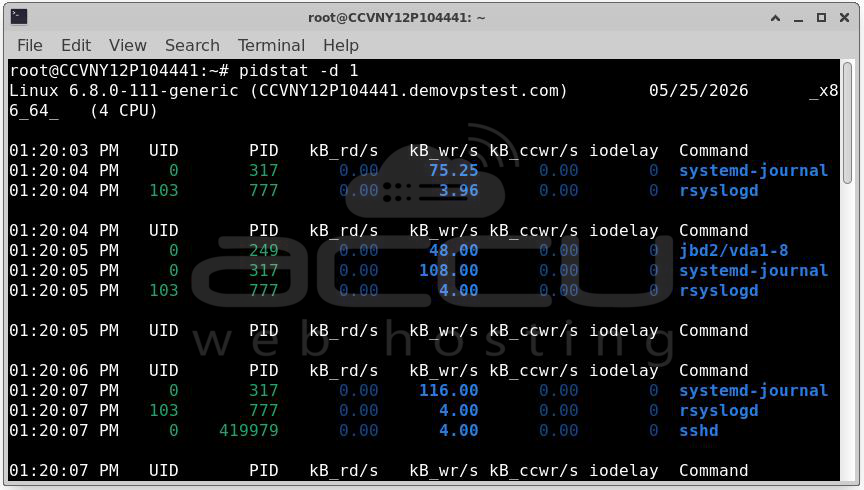
Once you have confirmed high iowait, your investigation splits into two tracks: which device is the bottleneck, and which process is responsible.
Identify the busiest disk: iostat -xz 1 | grep -v "^$"
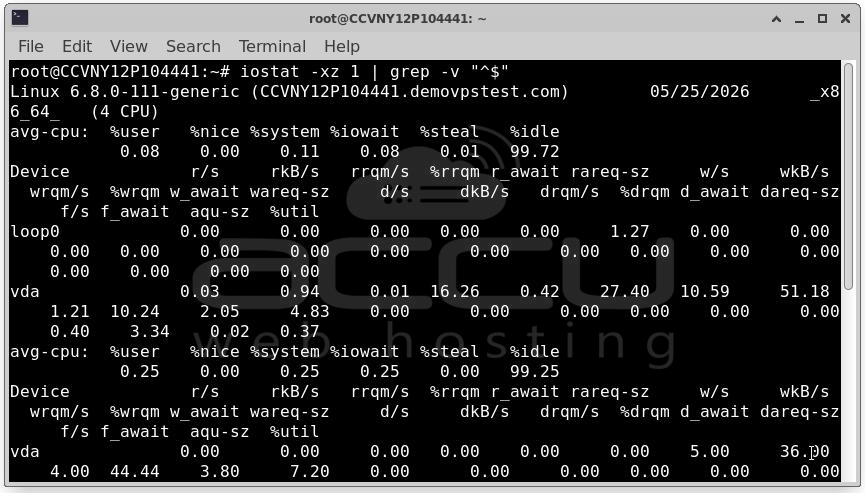
Look for high %util, high await (ms latency), high r/s or w/s
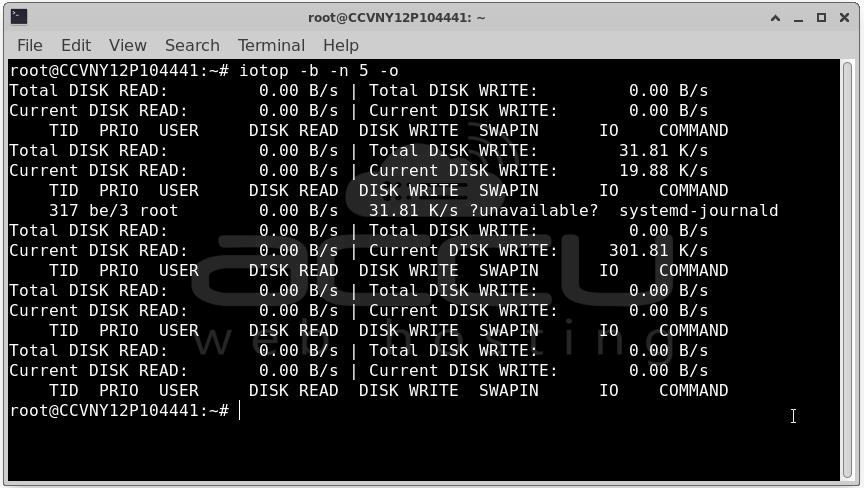
Find the top I/O consumers: iotop -b -n 5 -o
With that foundation in place, let us walk through every major cause and its solutions.
Cause 1: Undersized or Slow Storage Hardware
The Problem: The most fundamental cause of high iowait is simply that the storage medium cannot keep up with the workload's demands. This is especially common with:
- Traditional spinning HDDs serving random I/O workloads (databases, logging servers).
- Consumer-grade SSDs deployed in production environments where write endurance and IOPS are insufficient.
- Network-attached storage (NAS) or SAN with inadequate bandwidth or high latency.
- Shared cloud block storage (like AWS gp2 EBS volumes) hitting IOPS limits.
You will typically see await values above 10–20ms for HDDs and above 1–2ms for SSDs in iostat, combined with %util approaching 100%.
Solutions
Solution A: Upgrade to NVMe SSDs: The single highest-impact hardware change you can make. NVMe drives offer sub-millisecond latency and hundreds of thousands of IOPS versus the 100–200 IOPS typical of a 7200 RPM HDD. For databases and random-read workloads, this can reduce iowait from 40–60% down to under 5% without any application changes.
Solution B: Use RAID for throughput or redundancy
- RAID 0 (striping): Doubles throughput across two drives. No redundancy.
- RAID 10 (striped mirrors): Best of both worlds for databases — redundancy plus parallel I/O.
- RAID 5/6: Better space efficiency, but write penalty makes them poor for write-heavy workloads.
Solution C: Provision more IOPS on cloud storage: On AWS, move from gp2 to gp3 or io2 EBS volumes and explicitly provision the IOPS you need. On GCP, switch from standard persistent disks to SSD persistent disks or Hyperdisk Extreme. This is often the fastest fix in cloud environments.
Cause 2: Inefficient Application I/O Patterns
Hardware is fast, but the application is issuing I/O in pathological patterns:
- Synchronous, unbuffered writes: Each write waits for disk acknowledgment before proceeding.
- Tiny random writes: Thousands of 4KB writes per second saturate IOPS budgets.
- Read amplification: An ORM fetching entire rows when only two columns are needed, causing large unnecessary reads.
- Missing fsync batching: Databases calling fsync() on every transaction instead of grouping commits.
Solutions
Solution A: Enable write buffering and async I/O
If your application is using O_SYNC or O_DSYNC on file opens, evaluate whether that level of durability is truly required. Many applications default to sync writes out of caution when async writes with periodic flushing are sufficient.
For applications you control, switch to buffered writes and flush explicitly at logical transaction boundaries rather than per-operation:
# Instead of: write every record and sync
for record in records:
f.write(record)
f.flush()
os.fsync(f.fileno()) # Kills performance
# Do: buffer and sync once per batch
for record in records:
f.write(record)
f.flush()
os.fsync(f.fileno()) # One sync for the whole batch
Solution B: Use O_DIRECT with async I/O for databases: Databases like PostgreSQL and MySQL use their own buffer pool. When they also go through the kernel page cache, you get double-buffering and unnecessary cache pressure. Using O_DIRECT bypasses the page cache and lets the database manage its own caching, reducing iowait by eliminating redundant copies.
PostgreSQL already does this automatically. For MySQL/InnoDB, ensure innodb_flush_method = O_DIRECT is set.
Solution C: Batch and coalesce writes: Use write-ahead logging (WAL) patterns to accumulate changes in memory and flush sequentially. Sequential I/O is dramatically faster than random I/O on both HDDs and SSDs. This is why databases use WAL, turning random transactional writes into sequential log writes.
Cause 3: Insufficient RAM / Page Cache Thrashing
Linux uses free RAM as a page cache, recently read disk blocks are kept in memory so subsequent reads are served from RAM rather than disk. When RAM is exhausted, the kernel must evict cached pages to make room for new data or process memory, then re-read evicted pages from disk on next access. This is called page cache thrashing or swap thrashing.
Signs to look for:
Check memory usage: free -h

# If 'available' is near zero and swap is heavily used, RAM is the bottleneck
vmstat 1
Look for high 'si' (swap in) and 'so' (swap out) values
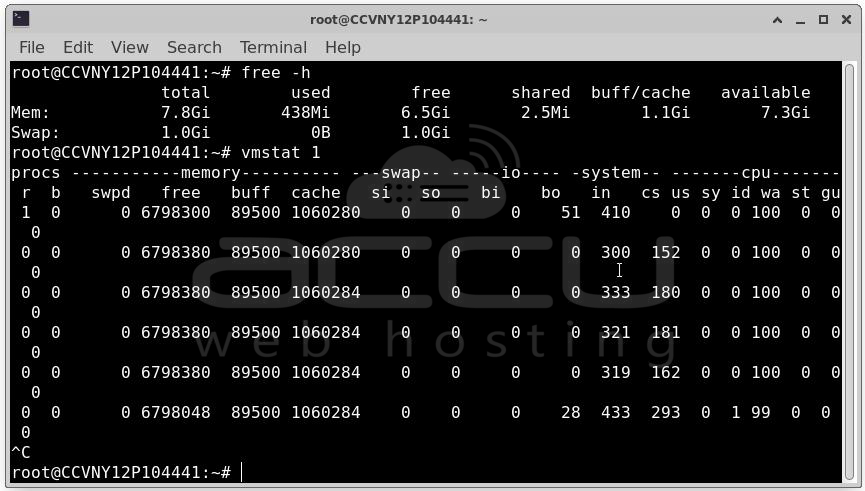
High swap activity combined with high iowait almost always means RAM exhaustion.
Solution A: Add more RAM: The most direct fix. Linux's page cache is extraordinarily effective, adding RAM reduces disk reads proportionally. A database server that fits its working set entirely in RAM can see iowait drop from 40% to under 1%.
Solution B: Tune vm.swappiness: The vm.swappiness kernel parameter (0–100) controls how aggressively the kernel swaps process memory to disk versus reclaiming page cache. The default is 60, which means the kernel will swap out process pages fairly willingly. For servers running databases or caches:
Check current value: cat /proc/sys/vm/swappiness
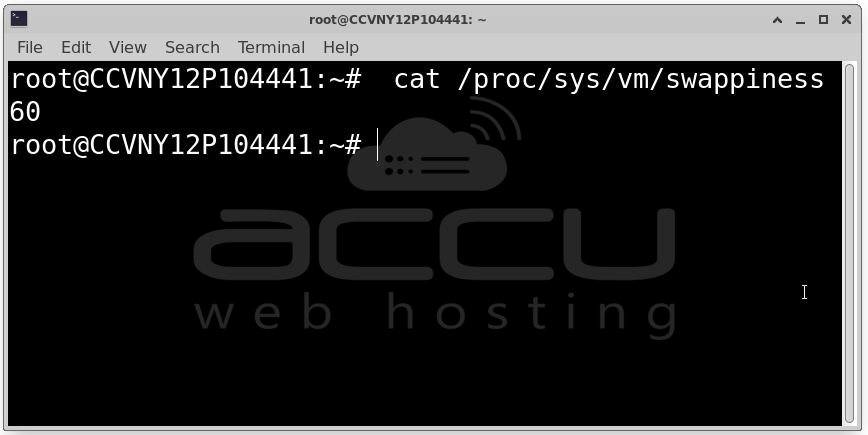
Set to 10 - prefer keeping process memory in RAM, reclaim page cache first
sysctl -w vm.swappiness=10
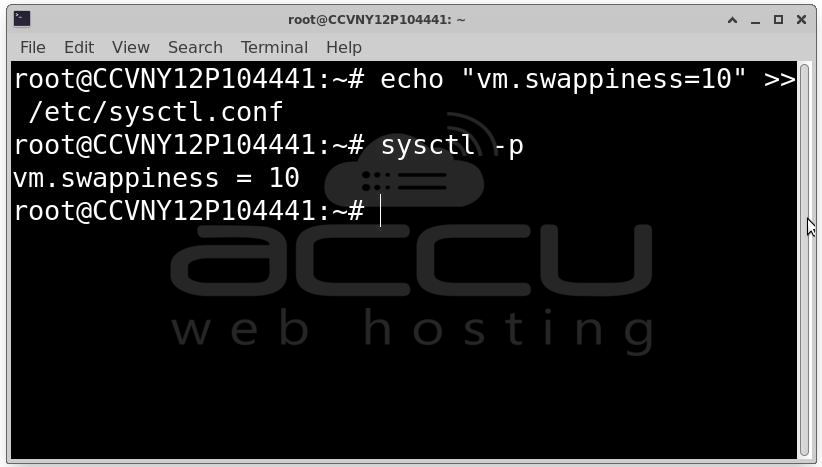
Make permanent:
echo "vm.swappiness=10" >> /etc/sysctl.conf
sysctl -p
For Redis and similar in-memory datastores, setting swappiness to 0 is often recommended (though 0 does not fully disable swapping).
Solution C: Use HugePages for database workloads: Databases with large buffer pools benefit enormously from Transparent HugePages (THP) or explicit HugePages. Fewer TLB misses mean faster memory access, reducing the frequency of cache misses that trigger disk reads.
For PostgreSQL and Oracle, configure explicit HugePages:
Calculate required HugePages:
grep -i hugepagesize /proc/meminfo

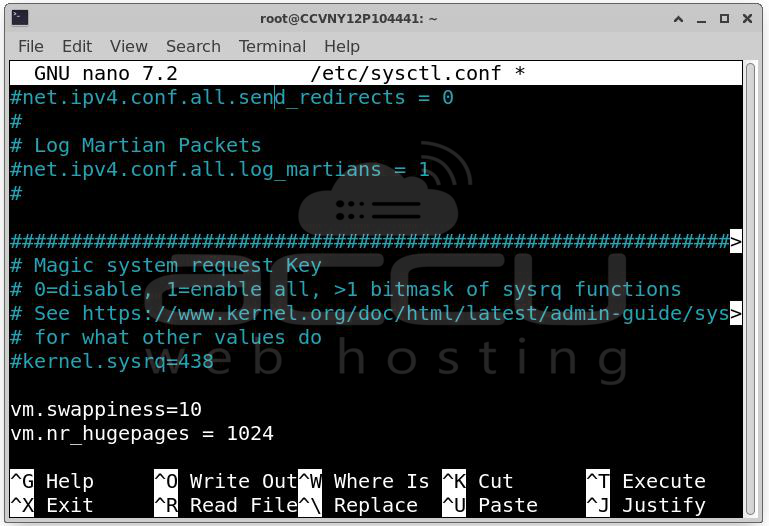
Set in /etc/sysctl.conf:
vm.nr_hugepages = 1024 # Adjust based on your shared_buffers / hugepagesize
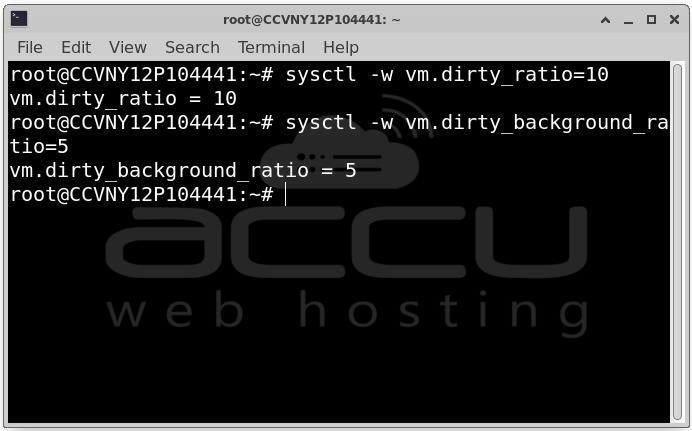
Solution D: Tune the page cache dirty ratios: If iowait spikes are periodic (every few seconds), the culprit is often the kernel flushing dirty pages in large batches. Tune the dirty page thresholds to write more frequently in smaller bursts:
# Default: flush when 20% of RAM is dirty
vm.dirty_ratio = 10 # Start flushing at 10%
vm.dirty_background_ratio = 5 # Background flush starts at 5%
vm.dirty_expire_centisecs = 1000 # Expire dirty pages after 10s
vm.dirty_writeback_centisecs = 500 # Flush every 5s
sysctl -w vm.dirty_ratio=10
sysctl -w vm.dirty_background_ratio=5
Cause 4: Database Bottlenecks
Databases are the single most common source of high iowait on application servers. The specific causes within databases include:
-
Missing indexes: Full table scans read entire tables from disk.
-
Oversized result sets: Queries returning far more data than needed.
-
Checkpoint storms: PostgreSQL or MySQL checkpointing all dirty buffer pool pages to disk simultaneously.
-
Redo log / WAL contention: Log files too small, causing frequent switches and flushing.
-
Buffer pool too small: The database cannot cache its working set in memory.
Solution A: Identify and add missing indexes
-- PostgreSQL: find sequential scans on large tables
SELECT schemaname, tablename, seq_scan, seq_tup_read,
idx_scan, n_live_tup
FROM pg_stat_user_tables
WHERE seq_scan > 0
ORDER BY seq_tup_read DESC
LIMIT 20;
-- MySQL: show queries without index usage
SHOW STATUS LIKE 'Select_full_join';
SHOW STATUS LIKE 'Select_scan';
-- Enable slow query log to catch bad queries
SET GLOBAL slow_query_log = 1;
SET GLOBAL long_query_time = 1;
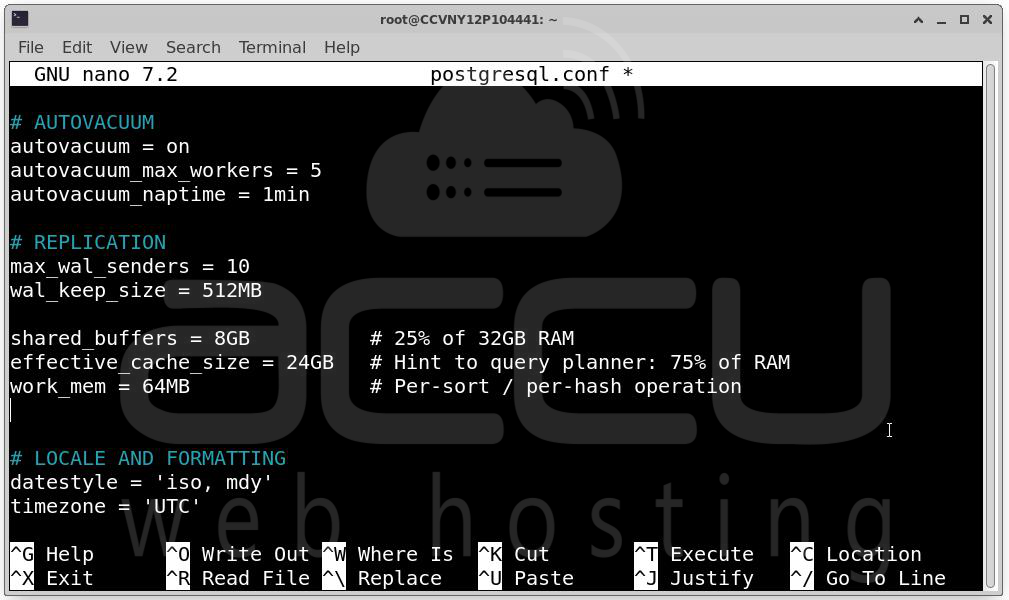
Solution B: Increase buffer pool / shared buffers: For PostgreSQL, shared_buffers defaults to 128MB — embarrassingly small for any production workload. Set it to 25% of available RAM as a starting point:
# postgresql.conf
shared_buffers = 8GB # 25% of 32GB RAM
effective_cache_size = 24GB # Hint to query planner: 75% of RAM
work_mem = 64MB # Per-sort / per-hash operation
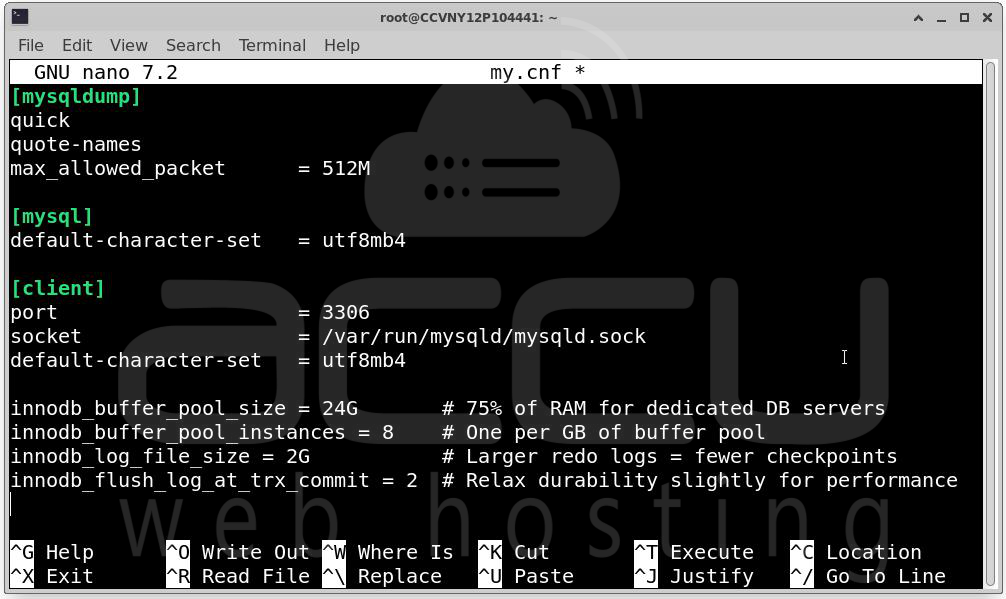
For MySQL/InnoDB:
# my.cnf
innodb_buffer_pool_size = 24G # 75% of RAM for dedicated DB servers
innodb_buffer_pool_instances = 8 # One per GB of buffer pool
innodb_log_file_size = 2G # Larger redo logs = fewer checkpoints
innodb_flush_log_at_trx_commit = 2 # Relax durability slightly for performance
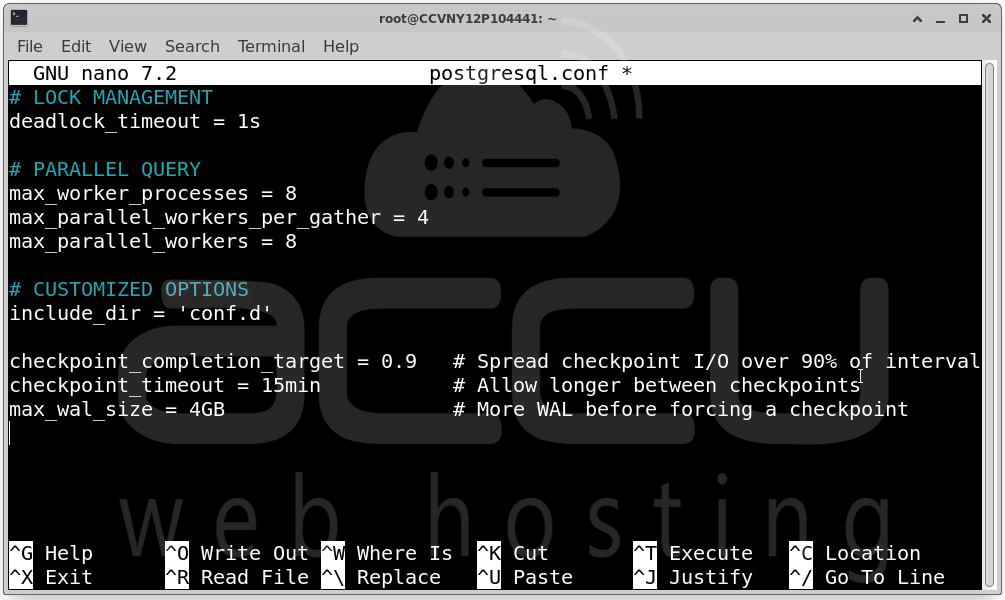
Solution C: Smooth out checkpoint storms
PostgreSQL checkpoints can cause massive iowait spikes. Spread the I/O over a longer window:
# postgresql.conf
checkpoint_completion_target = 0.9 # Spread checkpoint I/O over 90% of interval
checkpoint_timeout = 15min # Allow longer between checkpoints
max_wal_size = 4GB # More WAL before forcing a checkpoint
Solution D: Connection pooling to reduce I/O overhead
Each database connection maintains its own I/O context. Thousands of connections create thousands of competing I/O streams. Use PgBouncer (PostgreSQL) or ProxySQL (MySQL) to multiplex many application connections over a small pool of actual database connections.
Install PgBouncer: apt install pgbouncer
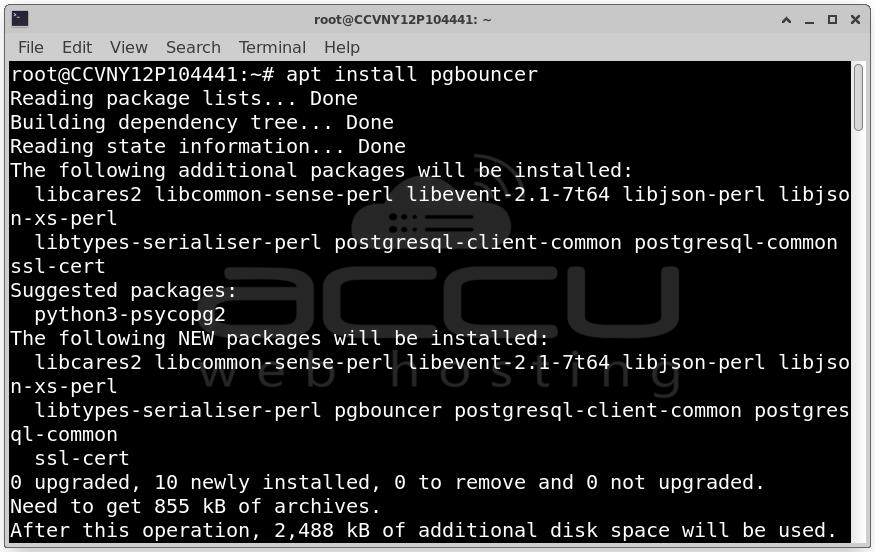
Key settings in pgbouncer.ini
pool_mode = transaction # Reuse connections per transaction
max_client_conn = 1000 # Frontend: accept up to 1000 app connections
default_pool_size = 20 # Backend: only 20 real DB connections

Cause 5: Log File and Audit Trail Overload
Applications logging at DEBUG level in production, audit daemons writing every syscall, or web servers logging every request with flush-on-write can generate enough I/O to saturate even fast SSDs. This is particularly insidious because it is invisible in application metrics, everything looks fine, but the OS is buried in log writes.
Identify the culprit:
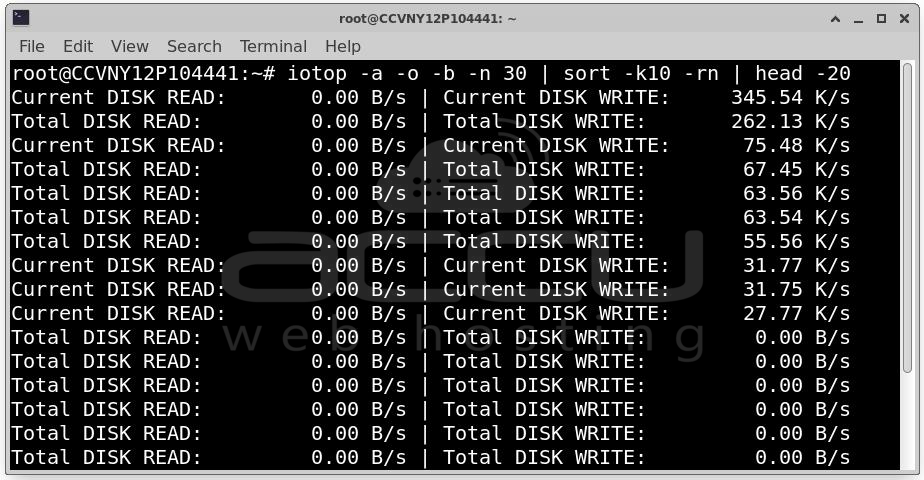
Find processes writing most to disk: iotop -a -o -b -n 30 | sort -k10 -rn | head -20
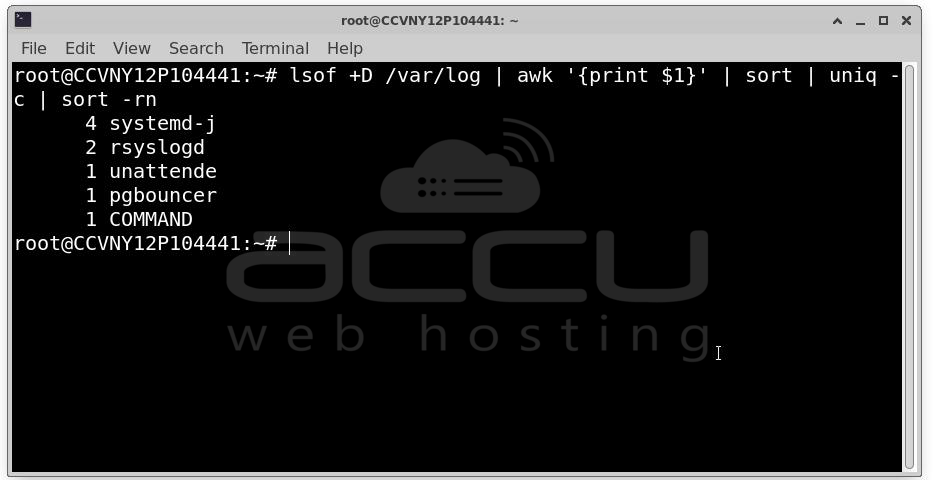
Check which files are being written heavily: lsof +D /var/log | awk '{print $1}' | sort | uniq -c | sort -rn
Solution A: Raise log levels in production
Change application log level from DEBUG or INFO to WARN or ERROR. This is the single easiest fix and can reduce log I/O by 90% or more with zero infrastructure changes.
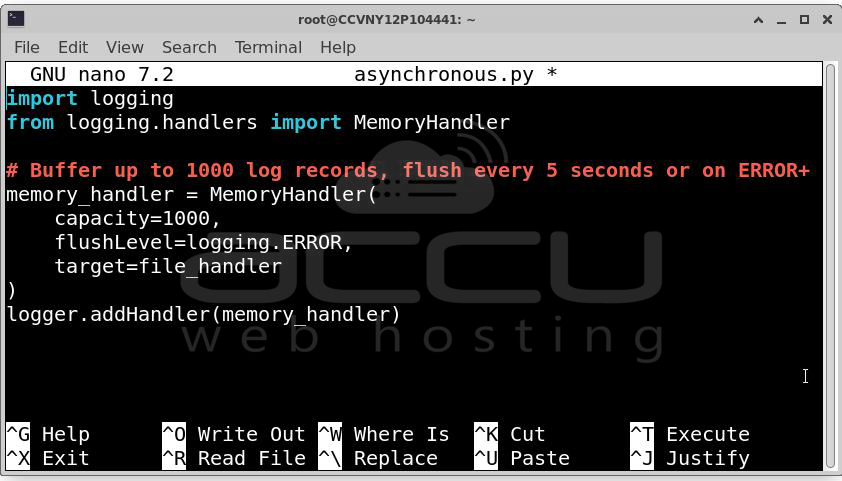
Solution B: Use asynchronous logging: Buffer log writes in memory and flush periodically rather than on every log line. In Java, use Log4j2's AsyncAppender. In Python, use logging.handlers.MemoryHandler. In Go, wrap your logger in a buffered writer.
import logging
from logging.handlers import MemoryHandler
# Buffer up to 1000 log records, flush every 5 seconds or on ERROR+
memory_handler = MemoryHandler(
capacity=1000,
flushLevel=logging.ERROR,
target=file_handler
)
logger.addHandler(memory_handler)
Solution C: Log to tmpfs / ramdisk
For high-frequency ephemeral logs (access logs, debug traces), write to a RAM-backed tmpfs mount and periodically archive to persistent storage:
Create a 2GB ramdisk for logs: mount -t tmpfs -o size=2G tmpfs /var/log/app-tmp
Rsync to persistent storage every 5 minutes: echo "*/5 * * * * rsync -a /var/log/app-tmp/ /var/log/app-archive/" | crontab -
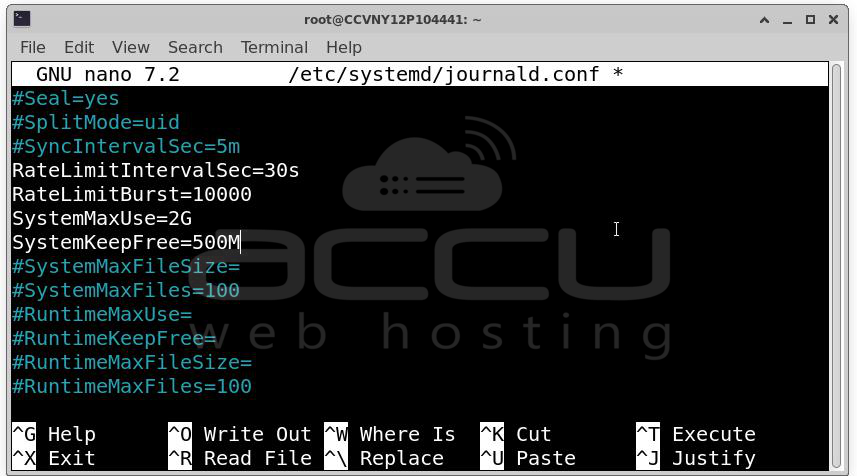
Solution D: Use journald with rate limiting
If systemd's journald is the culprit, rate-limit what it accepts:
# /etc/systemd/journald.conf
RateLimitIntervalSec=30s
RateLimitBurst=10000
SystemMaxUse=2G
RuntimeMaxUse=500M
Conclusion
High I/O wait is never a single-cause problem. It is the intersection of hardware capability, application behavior, OS configuration, and workload patterns. High iowait is solvable, often with nothing more than a sysctl change or a SQL index. Start with the cheapest, highest-impact fix first, measure again, and iterate.
