You can view your bandwidth usage by performing the following steps -
1. Log in to the OnApp control panel with the provided login details.
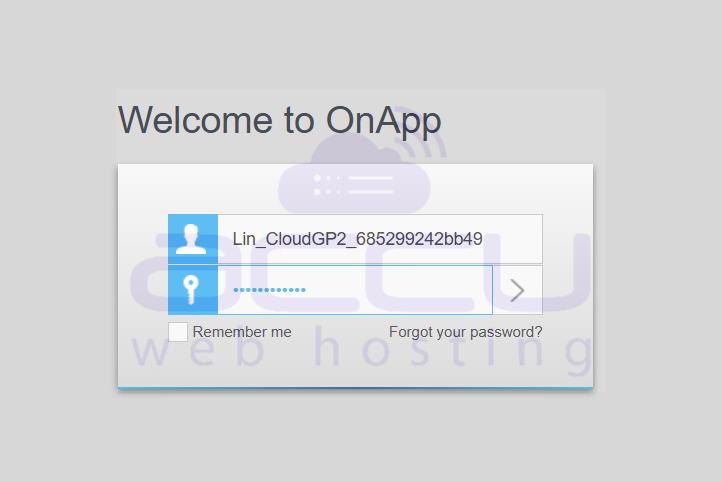
2. After successfully logging in, you will see your Dashboard.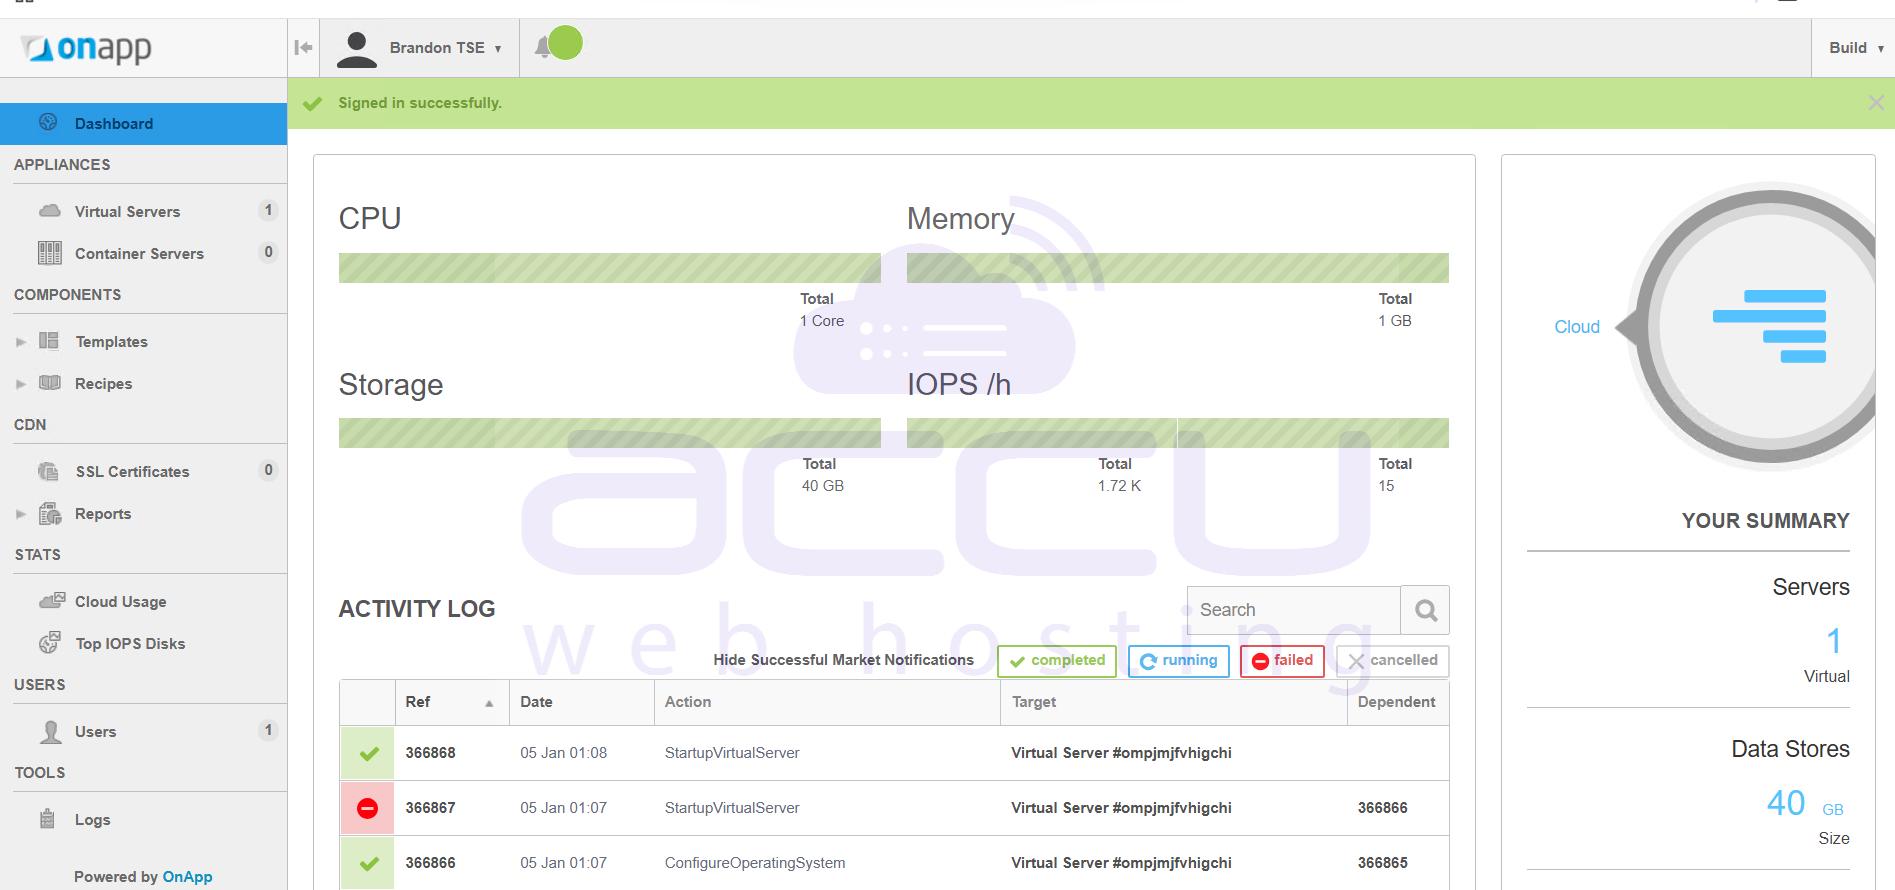
3. Click on the Cloud Usage option under the Stats section in the left pane.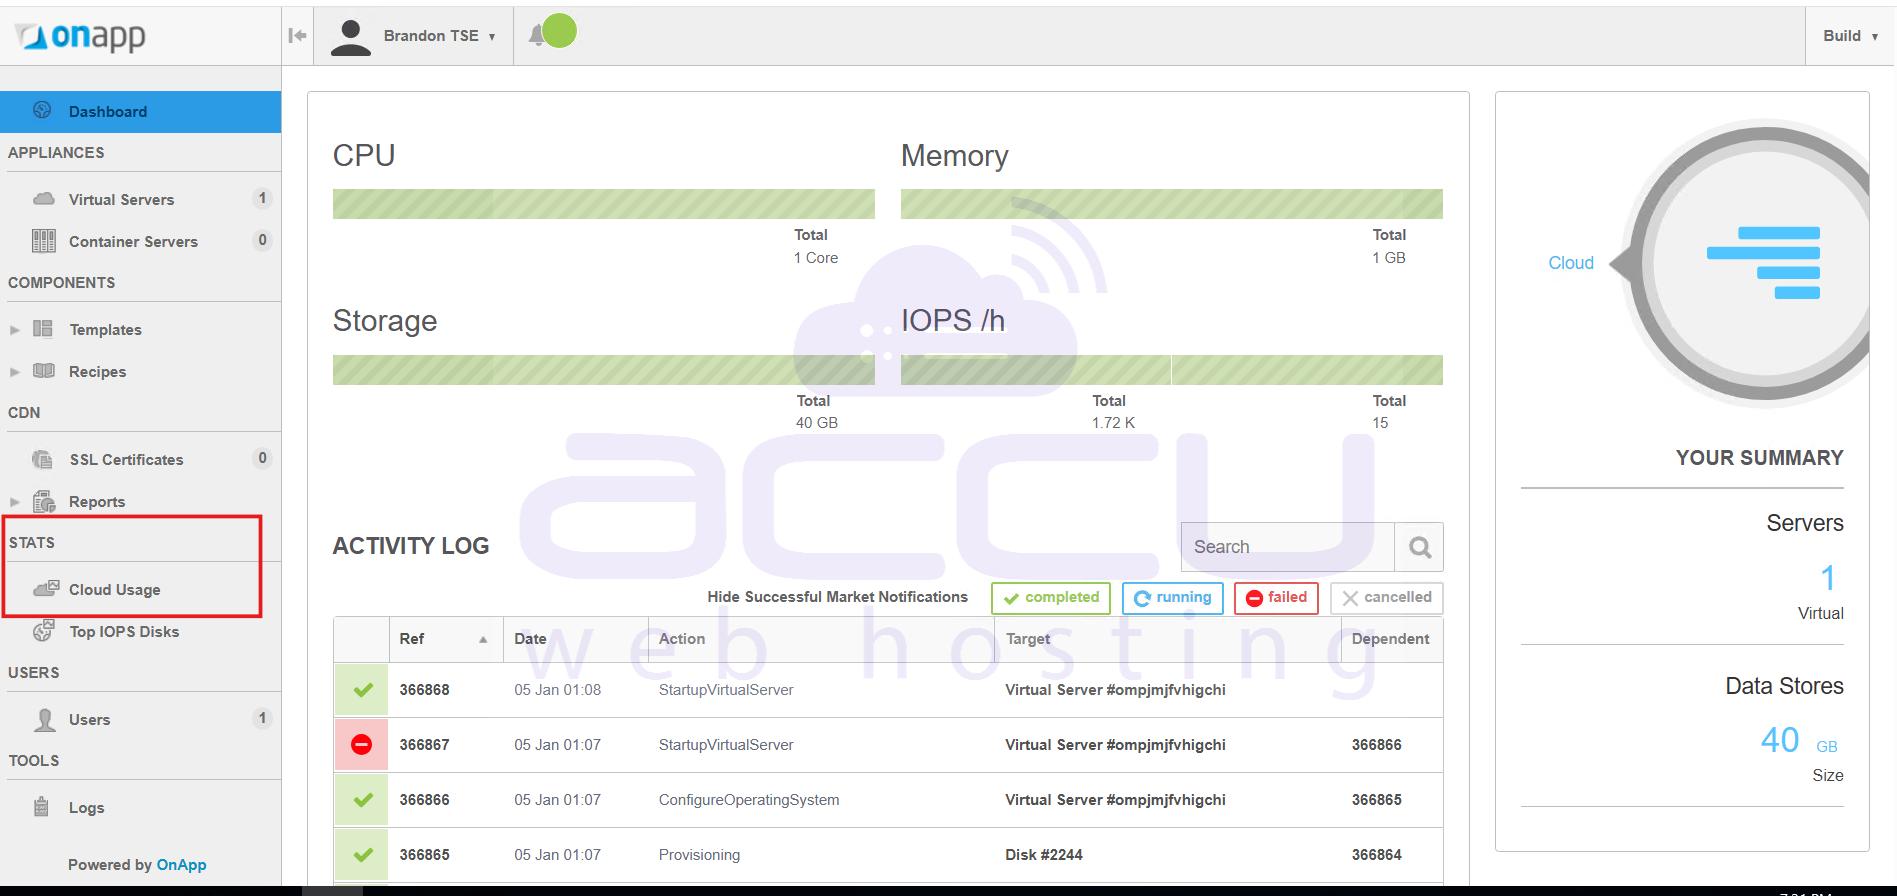
4. You will see a table containing the following details -
- Virtual Machine - VM name.
- Owner - Username of Owner.
- CPU Used - Average CPU usage of the last 72 hours or specified period.
- Disk Reads Completed - the number of read operations performed by the disk.
- Disk Writes Completed - the number of write operations performed by the disk.
- Disk Data Read - data read amount from a disk.
- Disk Data Written - data write amount to a disk.
- Bandwidth Sent - the number of bytes sent by a particular VM.
- Bandwidth Received - the number of bytes received by a particular VM.
5. If you don’t specify any time range, the state will show you statistics for the last 72 Hours.
For viewing data for a particular time range, select a specific Start Time and End Time, then click the Apply button.
Conclusion
Monitoring your Cloud VPS bandwidth usage in OnApp is essential for maintaining performance, controlling costs, and avoiding unexpected overage charges. By regularly checking bandwidth sent and received, you gain full visibility into your VPS traffic patterns, helping you diagnose spikes, plan upgrades, and ensure your resources align with your workload.
If you notice consistently high bandwidth consumption, it may be time to optimize your applications, scale your Cloud VPS resources, or upgrade to a higher bandwidth plan to maintain uninterrupted service. Proactive monitoring through the OnApp control panel empowers you to make data-driven decisions and keep your cloud infrastructure running smoothly.
For assistance with bandwidth optimization, plan upgrades, or Cloud VPS management, our support team is always available to help you choose the right solution for your growing needs.


