Many applications are built to hide detailed error logs for security reasons. However, sometimes, troubleshooting an issue requires you to enable detailed error logs. Below are the steps for the same.
1- Turn on IIS debugging for ASP
IIS doesn’t send debugging details to the browser by default. You can change this behavior and ask IIS to send details such as line number and trace to the user:
- Open IIS Manager. Click the application name
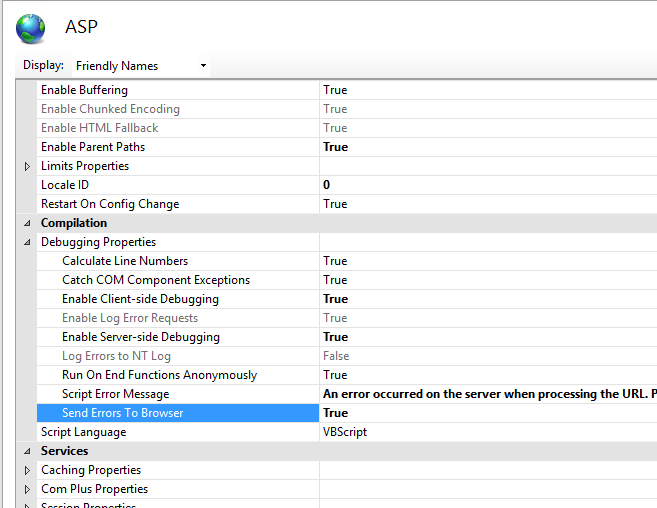
- Double click “ASP. “
- Expand “Debugging Properties“
- For the attribute “Send Errors to Browser, “select “True. “
2- Configure Error Pages
You can tell IIS to show details on common error pages such as 401, 404, and 500:
- Open IIS Manager. Click the application name
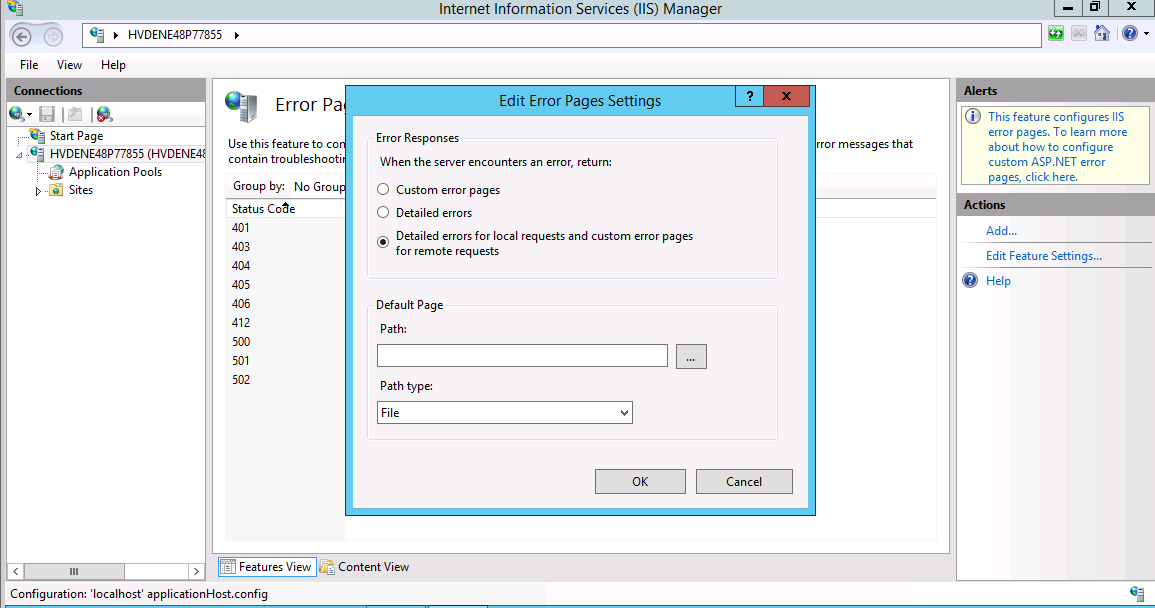
- Double click “Error Pages. “
- Click on the error code
- In Action Panel, click “Edit Feature Settings“And Select “Detailed errors. “
3:- You can enable detailed error messages for
your classic ASP site defaulted to Windows/IIS by using a web. config
file with the following:-
<configuration>
<system.webServer>
<httpErrors errorMode="Detailed" />
</system.webServer >
</configuration>
Note: Detailed errors are an excellent way to
troubleshoot your site code in classic ASP because the error messages
they generate on your site may contain information relevant to
the error you are experiencing and will assist you in resolving many
coding issues. However, please be mindful when using detailed errors on
a production site because the information output to the page can also be very revealing about how your code works and processes
information, which is particularly concerning for the security of your
site. Therefore we strongly recommend using detailed errors for sites that are in development or experiencing problems; conversely, we recommend disabling detailed errors while the site is in
production and not experiencing any issues.
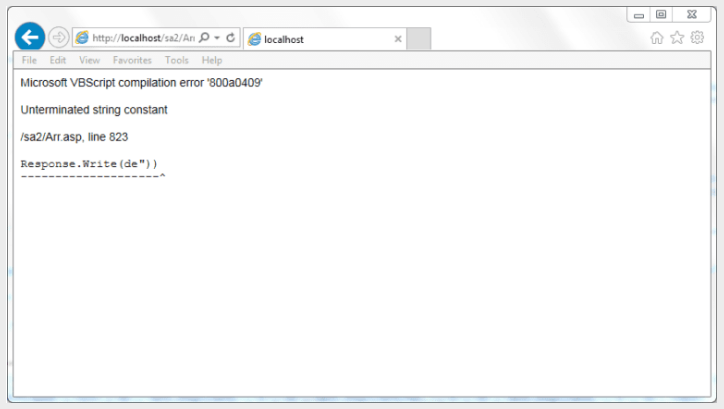
Once you enabled the display error from IIS, the error page looks like this::